.png)
Urban Heat Island Analysis Using GIS: Assessing Thermal Dynamics and LULC Change in Jaipur
- Ashish
- 15 minutes ago
- 16 min read
ABSTRACT
This study examined the relationship between Land Use/Land Cover (LULC) changes and urban thermal behaviour in Jaipur City over 15 years, focusing on 2010, 2015, and 2025. In this study multi-temporal Landsat images and Sentinel-2 time-series data was used. It combines a Random Forest LULC classification, which achieved over 93% accuracy, with various spectral indices (NDVI, NDBI, MNDWI, BSI, EBBI), and Land Surface Temperature (LST) extraction. To evaluate the thermal risk, a weighted overlay analysis was used to map the thermal vulnerability across the city. The findings show that Jaipur's thermal landscape is mainly influenced by notable built-up expansion, which grew by 43.8 km² from 2015 to 2025, and the exposure of bare soil. This urban growth was accompanied by an average LST increase of 4.49°C from 2010 to 2015. The SUHI analysis indicated that densely built-up areas in the central and southern parts of the city continually act as heat islands. High-vulnerability zones expanded into the eastern and northern edges as the city developed. Although there was a slight overall trend of greening, vegetation in the urban core dropped steadily from 72.95 km² in 2015 to 44.59 km² in 2025, worsening thermal stress. In contrast, the Aravalli hill ranges and nearby green patches effectively served as thermal buffers and cool areas. This study demonstrates that multi-temporal remote sensing and GIS provide an effective framework for monitoring urban heat dynamics.
1. Introduction
The rapid development of urban environments leads to changes in the types of surfaces available for solar radiation to interact with; a reduction in the amount of vegetation present and changes to the local energy budget of an area are also common. These factors typically lead to increased temperatures over land relative to rural or natural areas resulting in intensified UHI effects. The impact of such changes may be particularly significant in cities within arid and semi-arid climates such as Jaipur due to increased sensitivity of bare soils to heating prior to monsoon rains. Previous research into Jaipur has found positive correlations between rates of urbanization and LST values while declines in vegetation density are associated with greater thermal stresses (Khajuria & Kaushik, 2024). Building upon previous work this study will utilize multi-temporal RS and GIS methods to examine the influence of LULC changes between 2010, 2015 and 2025 on thermal characteristics at the land surface throughout Jaipur (Jalan & Sharma, 2014).
When the average annual historic LST exceeds 45°C during pre-monsoon months‚ even a small increase is highly meaningful․Particularly vulnerable are low-income‚ densely populated low-vegetation neighbour with low building insulation․A rise in LST will increase energy demand for cooling‚ worsen urban water supply during summer months when demand is high‚ and degrade outdoor thermal comfort‚ particularly in public spaces and gathering places․Potential ecosystem impacts may include a redoubled warming of the city‚ which could impact urban vegetation productivity‚ exacerbate soil-water infiltration and further reduce the cooling capacity of the Aravalli hill ecosystem (a natural green belt also under encroachment pressure)․Without evidence-based spatial planning‚ the city may continue to sprawl into thermally stressed peripheral areas that may lock the city into increasingly costly heat vulnerability in the future (Mathew et al., 2018).
The main goal of this study is to look at urban heat island patterns in Jaipur using a combined land use and land cover thermal framework (Loukika et al., 2021). The specific objectives are to map land cover change, identify thermal hotspots, assess surface urban heat island (SUHI) effects, and evaluate vulnerability using a weighted overlay (Dutta, 2026). Additionally, the study aims to understand the relationship between surface heating and changes in vegetation and built-up areas (Aggarwal & Misra, 2018). Since Jaipur is in a hot semi-arid area, it serves as a strong example of how urban growth and land changes affect surface temperature patterns (Mathew et al., 2023).
2. Study Area
The research area includes the administrative limits of the Jaipur Municipal Corporation (JMC), which encompasses the urban wards of Jaipur city in Rajasthan, India. Situated between roughly 26°44'N–27°06'N latitude and 75°40'E–75°56'E longitude, Jaipur is subject to a hot semi-arid climate, with summer temperatures frequently surpassing 40°C. The region features flat plains interspersed with the Aravalli hill ranges, introducing natural topographic diversity within the study area.
Spanning about 377 km², the study area falls within the JMC ward boundary. The key land cover types consist of densely built urban areas, sparse vegetation patches, seasonal water bodies, barren rocky terrain, the Aravalli hill ranges, and agricultural fringes. Over the study period, the city has notably expanded outward, especially towards the northwest, south, and east. Therefore, this study examined a city where land cover change and thermal stress are expected to interact strongly across space and time.


3. Data and Methods
3.1 Data acquisition
This study assessed urban heat island dynamics in Jaipur city using multi-temporal remote sensing and GIS analysis. All scenes were obtained from the USGS Landsat Collection 2, Level 2 Surface Reflectance product, providing atmospherically corrected surface reflectance and surface temperature bands downloaded from the USGS Earth Explorer. Cloud-free scenes from the April–May pre-monsoon period were selected to ensure thermal comparability between epochs. Sentinel-2 imagery was used to examine NDVI trends in the selected zones from 2017 to 2025.

Additional Data

3.2 Data preparation
All Landsat scenes were filtered by date, cloud cover, and study boundary. This boundary is the Jaipur Municipal Corporation Wards (JMC Wards). Thermal values were changed to land surface temperature using the USGS Collection 2 scale factor of 0.00341802 and an offset of 149.0. Reflectance bands were used after applying the standard Landsat scale factors. The Jaipur Municipal Corporation boundary served as the spatial extent for all outputs.
3.3 Spectral indices
A set of spectral indices was calculated to characterize the vegetation, built-up land, moisture, bare soil, and thermal stress (Sarif et al., 2023). These indices formed the foundation for both the LULC classification and heat analysis.

3.4 LULC classification
A Random Forest (RF) classifier was applied to map Jaipur JMC into six land cover classes: Built-up, Vegetation, Water, Barren, Hill, and Agricultural. RF was selected for its ability to handle high-dimensional feature spaces and nonlinear spectral relationships in mixed urban landscapes (Amini et al., 2022).
A 14-band feature stack was created for each epoch to serve as input for the classifier. This stack included six surface reflectance bands (SR), six spectral indices (NDVI, NDBI, MNDWI, BSI, EBBI, and LST), and two topographic layers (elevation and slope, derived from CartoDEM). Separate training sample shapefiles were created for each epoch by visually interpreting the Landsat composites in ArcGIS Pro. This approach ensured that each class was accurately represented for its specific epoch.
The classifier used 150 decision trees and six variables for each split. The training samples were split into a 70% training set and a 30% validation set. This was done using stratified random sampling to keep the class proportions consistent in both subsets. The RF model was trained separately for each epoch to consider the yearly changes in spectral data. Classification was carried out using Google Colab with Python and the scikit-learn library.
To assess accuracy, we evaluated the held-out 30% validation set. We used overall accuracy (OA), Kappa coefficient, producer's accuracy (PA), and user's accuracy (UA) for each class.
3.5 Thermal and vulnerability analysis
• Surface Urban Heat Island intensity (SUHI) was computed in ArcGIS Pro using zscore standardization of LST per epoch to highlight spatially anomalous thermal zones relative to the city-wide mean (Halder et al., 2022):
𝐒𝐔𝐇𝐈 = (𝐋𝐒𝐓 − 𝛍_𝐋𝐒𝐓) / 𝛔_𝐋𝐒𝐓
• The LST, NDVI, and NDBI rasters for each epoch were reclassified into five equalinterval classes (1 = Very Low to 5 = Very High thermal vulnerability) in ArcGIS Pro (Gupta et al., 2020), (R. K. Gupta & Gupta, 2024). NDVI was classified inversely (high vegetation = low vulnerability). The three reclassified layers were combined using a weighted overlay:

3.6 Trend analysis
NDVI trend graphs were generated using the Sentinel-2 time series from 2017 to 2025. LST trend graphs show how the surface temperature changed across the three Landsat epochs and help explain whether the selected zones became warmer or cooler over time. These graphs will be useful in supporting the spatial interpretation of vegetation changes and heat dynamics.
4. Results and Discussion
4.1 Indices
4.1.1 NDVI
NDVI ranged from −0.161 to 0.713 in 2010, −0.001 to 0.726 in 2015, and −0.158 to 0.799 in 2025, with mean values of 0.157, 0.211, and 0.241 respectively. The rising mean NDVI trend indicates an overall increase in vegetated cover across the JMC boundary, partly driven by the growth of peri-urban green patches and seasonal agricultural land in 2015. However, the spatial pattern revealed that high-NDVI pixels remained concentrated in fringe zones and along the Aravalli foothills, whereas the dense urban core persistently registered low NDVI values below 0.1. The wider NDVI range in 2025 (max 0.799) points to intensified vegetation in localized patches, even as urban expansion reduced overall vegetated area from 72.95 km² in 2015 to 44.59 km² by 2025. Negative NDVI values, which were present across all three epochs, corresponded to exposed rocky surfaces, dry riverbeds, and bare built-up rooftops.
Raster calculator
2010: (("L5_2010_B4_JW.tif" - "L5_2010_B3_JW.tif") / ("L5_2010_B4_JW.tif" + "L5_2010_B3_JW.tif"))
2015: (("L8_2015_B5_JW.tif" - "L8_2015_B4_JW.tif") / ("L8_2015_B5_JW.tif" + "L8_2015_B4_JW.tif"))
2025: (("L8_2025_B5_JW.tif" - "L8_2025_B4_JW.tif") / ("L8_2025_B5_JW.tif" + "L8_2025_B4_JW.tif"))


4.1.2 NDBI
NDBI values ranged from −0.390 to 0.605 in 2010, −0.387 to 0.301 in 2015, and −0.451 to 0.391 in 2025, with mean values of 0.091, 0.044, and 0.029 respectively. The declining mean NDBI across epochs is notable: while the built-up footprint grew by 48.72 km² over 15 years, the average NDBI fell, suggesting that newer urban additions on the periphery are mixed-use surfaces with lower spectral built-up intensity than the dense inner core. High NDBI values above 0.3 were concentrated in the main walled city and dense commercial and industrial regions of south-central Jaipur, where flat concrete rooftops dominate. The contraction of the NDBI maximum between 2010 (0.605) and 2015 (0.301) may reflect surface moisture differences between the April 2010 and May 2015 acquisition dates, as drier surfaces in April inflate the SWIR reflectance.
Raster calculator
2010: (("L5_2010_B5_JW.tif" - "L5_2010_B4_JW.tif") / ("L5_2010_B5_JW.tif" + "L5_2010_B4_JW.tif"))
2015: (("L8_2015_B6_JW.tif" - "L8_2015_B5_JW.tif") / ("L8_2015_B6_JW.tif" + "L8_2015_B5_JW.tif"))
2025: (("L8_2025_B6_JW.tif" - "L8_2025_B5_JW.tif") / ("L8_2025_B6_JW.tif" + "L8_2025_B5_JW.tif"))


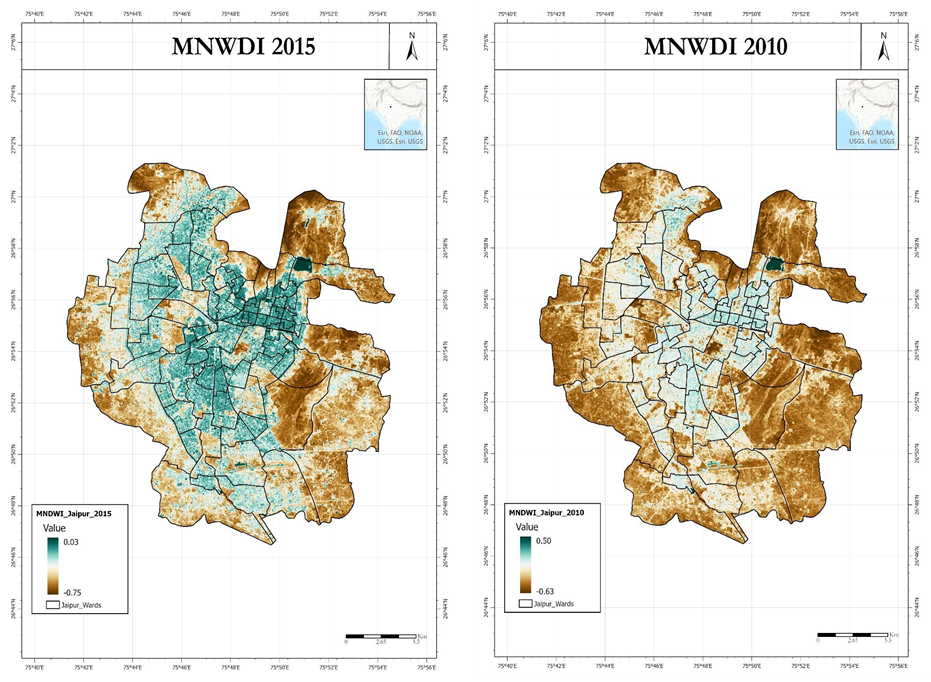
4.1.3 MNDWI
MNDWI was predominantly negative across the study area in all three epochs, with mean values of −0.325 (2010), −0.337 (2015), and −0.341 (2025). The consistently negative mean indicates that open water and moisture-rich surfaces occupy a minimal proportion of the JMC boundary. However, the maximum MNDWI values of 0.500 (2010), 0.035 (2015), and 0.296 (2025) reflect the presence of small water bodies and seasonal wet patches, the Man Sagar Lake and other urban tanks. The widening of the MNDWI range in 2025 (min −0.848) indicates increasing aridity in peripheral dry surfaces, while the positive extreme reflects a nearly ninefold expansion of mapped water bodies from 1.78 km² in 2010–2015 to 9.68 km² by 2025. Although spatially limited, this water body expansion contributes to localized evaporative cooling in its immediate surroundings (R. K. Gupta & Gupta, 2024).
Raster calculator
2010: (("L5_2010_B2_JW.tif" - "L5_2010_B5_JW.tif") / ("L5_2010_B2_JW.tif" + "L5_2010_B5_JW.tif"))
2015: (("L8_2015_B3_JW.tif" - "L8_2015_B6_JW.tif") / ("L8_2015_B3_JW.tif" + "L8_2015_B6_JW.tif"))
2025: (("L8_2025_B3_JW.tif" - "L8_2025_B6_JW.tif") / ("L8_2025_B3_JW.tif" + "L8_2025_B6_JW.tif"))

4.1.4 BSI
The mean BSI values were 0.079 (2010), 0.073 (2015), and 0.069 (2025), declining slightly across epochs as barren land area fell from 43.30 km² in 2010 to 35.69 km² by 2025. Maximum BSI values of 0.362, 0.158, and 0.162 across the three epochs highlighted exposed rocky and sandy surfaces concentrated in the Aravalli foothills and the arid periphery south of the urban core. In Jaipur’s semi-arid landscape, high-BSI zones are significant because dry sandy and rocky soils absorb solar radiation efficiently, heating to temperatures comparable to impervious built-up surfaces. The spatial co-occurrence of high BSI and high LST zones in the eastern and southern periphery explains the elevated surface temperatures in areas that do not show elevated NDBI, confirming the importance of BSI as a complementary thermal indicator in arid urban environments.
Raster calculator
2010: ((("L5_2010_B5_JW.tif" + "L5_2010_B3_JW.tif") - ("L5_2010_B4_JW.tif" + "L5_2010_B1_JW.tif")) / (("L5_2010_B5_JW.tif" + "L5_2010_B3_JW.tif") + ("L5_2010_B4_JW.tif" + "L5_2010_B1_JW.tif")))
2015: ((("L8_2015_B6_JW.tif" + "L8_2015_B4_JW.tif") - ("L8_2015_B5_JW.tif" + "L8_2015_B2_JW.tif")) / (("L8_2015_B6_JW.tif" + "L8_2015_B4_JW.tif") + ("L8_2015_B5_JW.tif" + "L8_2015_B2_JW.tif")))
2025: ((("L8_2025_B6_JW.tif" + "L8_2025_B4_JW.tif") - ("L8_2025_B5_JW.tif" + "L8_2025_B2_JW.tif")) / (("L8_2025_B6_JW.tif" + "L8_2025_B4_JW.tif") + ("L8_2025_B5_JW.tif" + "L8_2025_B2_JW.tif")))

4.1.5 EBBI
The maximum EBBI values of 12.57 (2010), 3.09 (2015), and 3.36 (2025) highlight surfaces combining high SWIR1 reflectance and high thermal emission, the dual signature of dense impervious material under intense solar heating. The high 2010 maximum reflects the drier acquisition date (April vs. May for later epochs), which elevated both SWIR1 and thermal DN.
Negative EBBI values (min −2.47 in 2010) correspond to vegetated and water surfaces where NIR reflectance exceeds SWIR1. Spatially, elevated EBBI co-localized with the highest LST zones in the urban core, confirming that EBBI captures the combined builtup–thermal signal more effectively than NDBI alone.
The decline in EBBI maximum between 2010 and 2015–2025 is consistent with the modest reduction in mean LST and marginal increase in vegetation cover, but hot-spot EBBI values remain elevated in the dense commercial zones of central Jaipur
Raster calculator
2010: (("L5_2010_B5_JW.tif" - "L5_2010_B4_JW.tif") / (10 * Sqrt("L5_2010_B5_JW.tif" + (("L5_2010_B6_JW.tif" * 0.00341802) + 149.0))))
2015: (("L8_2015_B6_JW.tif" - "L8_2015_B5_JW.tif") / (10 * Sqrt("L8_2015_B6_JW.tif" + (("L8_2015_B10_JW.tif" * 0.00341802) + 149.0))))
2025: (("L8_2025_B6_JW.tif" - "L8_2025_B5_JW.tif") / (10 * Sqrt("L8_2025_B6_JW.tif" + (("L8_2025_B10_JW.tif" * 0.00341802) + 149.0))))

4.1.6 LST
The mean LST increased by 4.49°C between 2010 and 2015, coinciding with the period the of highest built-up expansion and agricultural land loss (N. Gupta et al., 2020). Between 2015 and 2025, the mean LST showed a marginal decrease of 0.38°C, potentially linked to the increase in vegetation and water body coverage observed in the 2025 LULC results. The minimum LST in 2010 (27.11°C) was notably lower than that in subsequent epochs, reflecting the cooler and more vegetation-rich land cover composition of that period.

Raster calculator
2010: Con(("L5_2010_QA_PIXEL_JW.tif" == 5440) | ("L5_2010_QA_PIXEL_JW.tif" == 5504), ("L5_2010_B6_JW.tif" * 0.00341802) + 149.0 - 273.15)
2015: ("L8_2015_B10_JW.tif" * 0.00341802) + 149.0 - 273.15
2025: Con(("L8_2025_QA_JW.tif" == 21824) | ("L8_2025_QA_JW.tif" == 21888), ("L8_2025_B10_JW.tif" * 0.00341802) + 149.0 - 273.15)

4.2 LULC
4.2.1 Random Forest classification
Random Forest was selected because it is effective for mixed urban landscapes and can handle nonlinear spectral relationships (Amini et al., 2022). Training samples were prepared for each epoch and used to classify the Landsat images. The results were validated using overall accuracy, kappa, producer accuracy, and user accuracy.

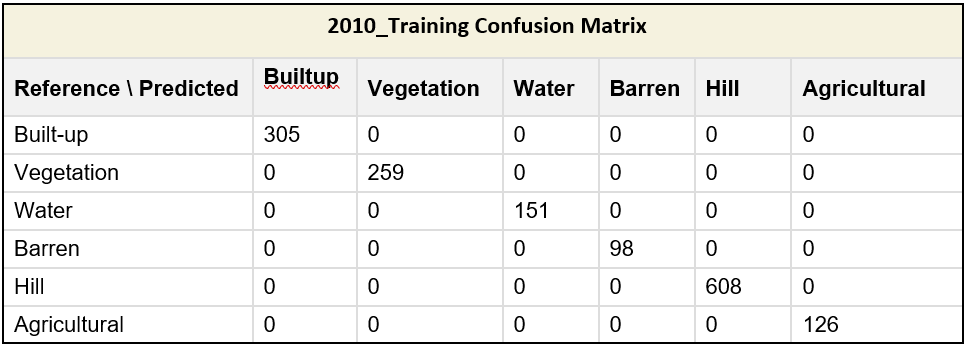
- Accuracy assessment
All three epochs achieved a high classification accuracy. The 2010 and 2025 models performed particularly well (OA >96%, Kappa >0.95), while 2015 showed slightly lower accuracy (OA 93.47%, Kappa 0.894), likely due to spectral confusion between the Agricultural and Barren classes in the dry pre-monsoon period. The built-up and hill classes achieved near-perfect accuracy across all years. The Barren class in 2025 recorded the lowest producer's accuracy (70%), reflecting spectral overlap with a sparsely built-up periphery.


4.2.3 2010 results
The 2010 map shows a comparatively smaller built-up footprint and more open surfaces than the maps of later years. Vegetation and agricultural land occupy a larger share of the periphery, whereas barren land and hills appear in the transitional and elevated zones. This provided a baseline urban structure for subsequent comparisons.


4.2.4 2015 results
The 2015 map showed increased urban expansion and more fragmented vegetation than that of 2010. Built-up areas expanded into the surrounding zones, whereas some agricultural and open spaces were converted into developed land. This epoch reflects an intermediate stage of urbanization.


4.2.5 2025 results
The 2025 map shows the most developed urban pattern, with stronger built-up continuity and more pronounced land cover fragmentation. Vegetation remains, but urban and exposed surfaces dominate the thermal core and transition zones. This year served as the final reference for the most recent urban conditions.


4.2.6 Change detection
Between 2010 and 2015, the dominant transition was the loss of agricultural land (−30.5 km²) and barren surfaces (−15.6 km²), primarily converted to built-up use (+10.8 km²) and reclassified as vegetation (+10.8 km²). The hill class also contracted by 7.8 km², reflecting encroachment at the lower fringe of the Aravalli. The water body area declined marginally (−0.8 km²), consistent with the dry pre-monsoon acquisition period of both scenes.
The 2015–2025 interval saw a more pronounced urban expansion, with the built-up area growing by 43.8 km², nearly three times the rate of the preceding period. Vegetation declined sharply by 30.6 km², and barren land contracted by 18.0 km², both converted into urban and mixed-use surfaces.
In this period there is the significant increase in water body area (+7.8 km²), which is likely linked to the development of water harvesting infrastructure, including the Dravyavati River Project, Mansagar Lake restoration, and the expansion of mapped urban water bodies, including tanks and reservoirs. Agricultural land showed a slight recovery (+7.8 km²) during this period after severe losses during 2010–2015, possibly reflecting enhancement of soil moisture and recharge of groundwater because of heavy rainfall in 2024, or alternatively it may be seasonal differences in the May 2025 acquisition relative to the May 2015 baseline. The overall 15-year trajectory confirms the progressive conversion of open, green, and agricultural surfaces into an impervious urban fabric, with the Aravalli hills under sustained peripheral pressure.


4.3 Thermal and vulnerability analysis
4.3.1 SUHI
SUHI maps revealed consistent spatial patterns across all epochs: dense built-up areas in central and southern Jaipur registered as persistent heat island cores, whereas the Aravalli hill ranges and vegetated patches formed cool island corridors. The 2025 SUHI map shows the expansion of the high-SUHI zone toward the eastern and northern periphery, consistent with the outward growth of built-up areas.
𝐒𝐔𝐇𝐈 = (𝐋𝐒𝐓 − 𝛍_𝐋𝐒𝐓) / 𝛔_𝐋𝐒𝐓
Pixels with SUHI > +1σ represent significant heat island zones. Pixels < −1σ represent cool islands (vegetation, water, and hills). The spatial pattern closely mirrors the built-up density, confirming the urban fabric as the primary thermal driver.
Raster calculator
2010: ("L5_2010_LST.tif" - [Mean LST]) / [StdDev LST]
2015: ("L8_2015_LST.tif" - [Mean LST]) / [StdDev LST]
2025: ("L8_2025_LST.tif" - [Mean LST]) / [StdDev LST]

4.3.2 Weighted overlay
The weighted overlay map combined the LST, inverse NDVI, and NDBI indicators to show thermal vulnerability. High and very high vulnerability zones are concentrated in dense urban and mixed fringe areas, where heat and low vegetation overlap.
In 2010, moderate-to-low thermal vulnerability dominated the study area, reflecting a more balanced land cover with significant agricultural and vegetation cover surrounding the urban core. By 2015, high- and very-high-vulnerability zones expanded in the southern and eastern urban fringes, coinciding with built-up expansion. The 2025 vulnerability map shows the largest spatial extent of high vulnerability, consistent with the 43.8 km2 increase in the built-up area during 2015–2025.
The Aravalli hill range consistently registered as having Very Low vulnerability across all epochs, providing a natural thermal buffer. The progressive expansion of thermally vulnerable zones from the urban core toward the periphery illustrates a classic (R. K. Gupta, 2024).
Raster calculator (0.40 * LST_score) + (0.30 * Inverse_NDVI_score) + (0.30 * NDBI_score)

4.4 Trend graphs
4.4.1 NDVI trend
The Sentinel-2 NDVI time series across the five zones revealed differentiated vegetation dynamics within the JMC boundary.
The Urban Core maintained persistently low NDVI (~0.12–0.15) with a modest but significant positive trend (+0.0009/yr, p < 0.001), suggesting incremental greening from street trees and green spaces in the area.
The Peri-Urban zone showed an identical trend at a higher baseline (~0.20), reflecting the slow expansion of suburban green patches.
The Aravalli Hills showed no significant trend (p = 0.724), confirming ecological stability, and its high monsoon NDVI (0.5–0.7) reinforces its role as the city's primary cool island.
The Barren Fringe recorded a small but significant positive trend (+0.0002/yr), indicating gradual vegetation colonization at the urban edge.
The Green Patch zone showed the strongest growth (+0.0062/yr, p < 0.001) with the widest seasonal amplitude (0.2–0.7), driven by monsoon flushes on agricultural and semi-natural surfaces.
In all zones the NDVI peaks were found to coincide with the rainy season (July– September) emphasizing the rainfall control in the vegetation dynamics of Jaipur's semi-arid climate.

4.4.2 LST trend
Zonal LST analysis shows that barren land consistently recorded the highest mean LST across all epochs (53.0°C, 52.1°C, 51.0°C), exceeding built-up surfaces (49.1°C, 49.0°C, 47.9°C), a characteristic thermal signature of semi-arid cities where exposed rocky and sandy soils heat as intensely as impervious surfaces.
Agricultural land registered similarly high values (~52°C in 2010 and 2015), reflecting dry harvested fields during the pre-monsoon period.
Water bodies recorded the lowest mean LST, confirming their evaporative cooling function, whereas the Hill and Vegetation classes maintained consistently lower temperatures across all epochs, underlining their role as natural thermal buffers (Khajuria & Kaushik, 2024).
The slight reduction in the class-wise mean LST from 2015 to 2025 was caused by increased spatial heterogeneity within each class, as urban growth creates new lowdensity surfaces in outer periphery, as depicted in the overall LST maps, eco-verges and other zones continue to experience intense LST.

Conclusion
This study confirms that Jaipur still has a significant surface urban heat island (SUH) effect. Surface temperatures are higher in densely populated and heat-prone surfaces. The time series analysis showed that both vegetated land covers, soil surfaces and new construction affect temperature variations throughout the entire area of Jaipur; thus, supporting the idea that changes in land use can be closely related to the formation of urban heat islands (Mathew et al., 2023).
Results indicated that NDVI improved at large scale from 2010-2025 and demonstrated localized greenness increases within portions of the ROI; however, BSI and LST suggested continued importance of exposed soils and high impervious surfaces in generating thermal stress. In addition, SUHI and weighted overlay outputs confirmed that the core and transition zone areas were the most thermally sensitive regions in Jaipur and therefore should be targeted first by planners (Bhattacharjee et al., 2022; Mathew et al., 2024).
In summary, this clearly demonstrated the utility of remote sensing and Geographic Information Systems to track urban heat patterns and identify potential targets for urban cooling. Therefore, for Jaipur, practical planning options would focus on increasing greenery, maintaining open/moist surfaces, improve land management practices in fringe zones, and promote heat-sensitively designed cities.
References
Aggarwal, S., & Misra, M. (2018). Comparison of NDVI, NDBI as indicators of surface heat island effects for Bangalore and New Delhi: Case Study.
Https://Doi.Org/10.1117/12.2325738, 10793, 178. https://doi.org/10.1117/12.2325738
Amini, S., Saber, M., Rabiei-Dastjerdi, H., & Homayouni, S. (2022). Urban Land Use and Land Cover Change Analysis Using Random Forest Classification of Landsat Time Series. Remote Sensing 2022, Vol. 14, Page 2654, 14(11), 2654.
Assessing role of LULC change in inducing UHI in Jaipur district, Rajasthan, India: A case study from 2009-2019 | Udit Asopa. (n.d.). Retrieved May 31, 2026, from https://uditasopa.netlify.app/publication/2022_sjst/
Bhattacharjee, A., Kamble, S., Kamal, N., Golhar, P., Kumari, V., & Bhargava, A. (2022). Urban Heat Island Effect: A Case Study of Jaipur, India. International Journal of Earth Sciences Knowledge and Applications, 4(1), 133–139. http://www.ijeska.com/index.php/ijeska/article/view/125
Dutta, C. K. (2026). Environmental Impacts of Opencast Coal Mining in the Margherita-Ledo Region, Assam, India: A Temporal Analysis using NDVI, NDBI and LST. https://doi.org/10.21203/RS.3.RS-8397493/V1
Gupta, N., Mathew, A., & Khandelwal, S. (2020). Spatio-temporal impact assessment of land use / land cover (LU-LC) change on land surface temperatures over Jaipur city in India. International Journal of Urban Sustainable Development,
12(3), 283–299. https://doi.org/10.1080/19463138.2020.1727908
Gupta, R. K. (2024). Green Space Cooling Effect and Relation to Mitigate Surface
Urban Heat Island Effect of Metropolitans Cities of India. Current World
Environment, 19(2), 679–691. https://doi.org/10.12944/CWE.19.2.13
Gupta, R. K., & Gupta, R. K. (2024). Geospatial and Statistical Analysis of Land Surface Temperature and Land Surface Characteristics of Jaipur and Ahmedabad Cities of India. Journal of Geoscience and Environment Protection, 12(8), 1–19. https://doi.org/10.4236/GEP.2024.128001
Halder, B., Bandyopadhyay, J., Al-Hilali, A. A., Ahmed, A. M., Falah, M. W., Abed, S. A., Falih, K. T., Khedher, K. M., Scholz, M., & Yaseen, Z. M. (2022). Assessment of Urban Green Space Dynamics Influencing the Surface Urban Heat Stress Using Advanced Geospatial Techniques. Agronomy 2022, Vol. 12, Page 2129, 12(9), 2129. https://doi.org/10.3390/AGRONOMY12092129
Jalan, S., & Sharma, K. (2014). Spatio-temporal Assessment of Land Use/ Land Cover Dynamics and Urban Heat Island of Jaipur City using Satellite Data. The International Archives of the Photogrammetry, Remote Sensing and Spatial Information Sciences, XL–8(1), 767–772. https://doi.org/10.5194/ISPRSARCHIVES-XL-8-767-2014
11. Khajuria, N., & Kaushik, S. P. (2024). Dynamic trends in land surface temperature and land use/land cover transitions in semi-arid metropolitan city, Jaipur.
Environmental Monitoring and Assessment, 197(1).
Loukika, K. N., Keesara, V. R., & Sridhar, V. (2021). Analysis of Land Use and Land Cover Using Machine Learning Algorithms on Google Earth Engine for Munneru River Basin, India. Sustainability 2021, Vol. 13, Page 13758, 13(24), 13758. https://doi.org/10.3390/SU132413758
Mathew, A., Arunab, K. S., & Kumar Sharma, A. (2024). Revealing the urban heat Island: Investigating spatiotemporal surface temperature dynamics, modeling, and interactions with controllable and non-controllable factors. Remote Sensing
Applications: Society and Environment, 35, 101219.
Mathew, A., Khandelwal, S., & Kaul, N. (2018). Investigating spatio-temporal surface urban heat island growth over Jaipur city using geospatial techniques.
Sustainable Cities and Society, 40, 484–500. https://doi.org/10.1016/J.SCS.2018.04.018
Mathew, A., Sarwesh, P., Khandelwal, S., Raja Shekar, P., Omeiza Alao, J., Abdo, H. G., Almohamad, H., & Abdullah Al Dughairi, A. (2023). Thermal dynamics of Jaipur:
Analyzing urban heat island effects using in-situ and remotely sensed data. Cogent Engineering, 10(2). https://doi.org/10.1080/23311916.2023.2269654
Sarif, M. O., Gupta, R. D., & Murayama, Y. (2023). Assessing Local Climate Change by Spatiotemporal Seasonal LST and Six Land Indices, and Their Interrelationships with SUHI and Hot–Spot Dynamics: A Case Study of Prayagraj City, India (1987– 2018). Remote Sensing, 15(1), 179. https://doi.org/10.3390/RS15010179/S1


Comments