.png)
NDVI Analysis Using Python: Urban Vegetation Change Detection with Rasterio and GeoPandas
- Emeka James Onele (Nigeria)
- Apr 28
- 4 min read
ABSTRACT
This project developed an Automated Urban Vegetation Monitoring System to assess green cover changes in Ezza North LGA, Ebonyi State, using multispectral raster data from 2023 and 2024. NDVI was calculated from NIR and Red bands with Rasterio, NumPy, and GeoPandas after clipping to the study area boundary. Results showed a slight decline in vegetation condition, with moderate vegetation decreasing by 2,993 hectares while low vegetation/bare areas increased by 3,041 hectares. High density vegetation nearly disappeared. The findings indicate increasing pressure on green cover and highlight the need for better vegetation conservation in the region.
INTRODUCTION
This project presents an Automated Urban Vegetation Monitoring System for Ezza North Local Government Area of Ebonyi State, Nigeria. The study analyzes the changes in urban green cover between 1st of January 2023 and 31st of December 2024 (24 calendar months) using Sentinel-2 satellite imagery (Red and NIR bands). The Normalized Difference Vegetation Index (NDVI) was calculated to assess vegetation health and density, while a change detection map was generated to show areas of vegetation gain, loss, and stability.
OBJECTIVES OF STUDY
• To compute NDVI rasters for selected dates
• To generate False Colour Composite (FCC) images
• To produce a vegetation summary table
• To create thematic NDVI maps and change intelligence map
• To interpret the vegetative conditions of Abakaliki over the study period
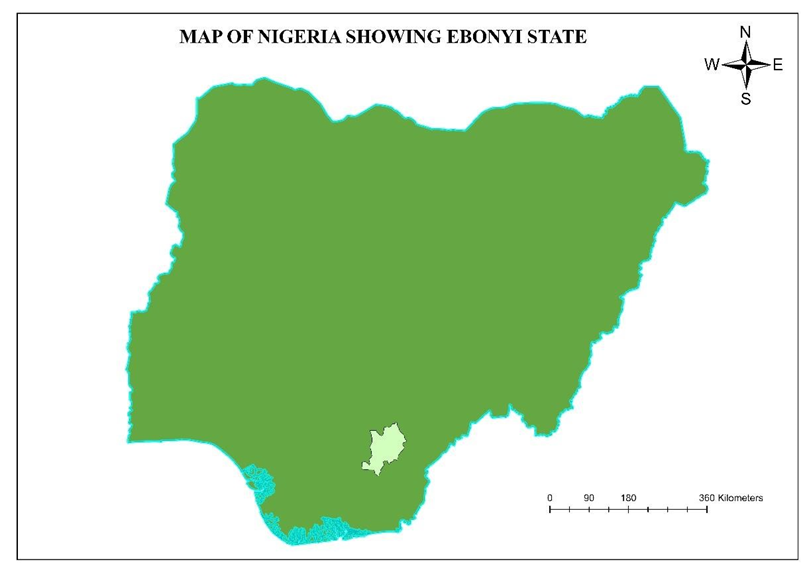
STUDY AREA
The study was conducted within the administrative territory of Ezza North Local Government Area (EN-LGA) of Ebonyi state. EN-LGA comprises of Eleven (11) wards that collectively represent a complex and rapidly growing semi-urban settlement. The area exhibits spatial homogeneity in terms of Land use, population distribution and minor infrastructure development with major forest/agricultural vegetation. EN-LGA portrays a combination of dense vegetative cores, scattered residential areas, emerging building expansion zones, and a very few industrial corridors. The spatial diversity results is as a result of developmental intensity across the LGA. The area is also characterized by rocky earth crust and scattered quarries for stone mining. With a growing population, the Local government area is gradually showing an increment in developmental activities coupled with its nearness to the Urban Abakaliki Metropolis.


DATA USED
Ezza North Local Government Area Boundaries
Geometry Type: Polygon
Administrative Units: 1 Local government area
Projection: EPSG:4326 (WGS 84 Datum)
Purpose: Spatial aggregation unit for vegetative analysis
Datasets: Sentinel-2 JP2 files [Red (Band 4) and NIR bands (Band 8)] from January 1st 2023 to December 31st 2024 + Ezza North boundary shapefile
Software Environment
ArcGIS – Processing of raw raster data and cartographic output.
Google Colab- Query into Python Libraries (Rasterio, NumPy, GeoPandas, Matplotlib)
METHODOLOGY
The methodology adopted in this study combines spatial data preprocessing, Python Library spatial querying, and decision-based classification. The workflow was done using ArcGIS for preprocessing and visualization, and Python Libraries for spatial database analysis.
Data Preprocessing and Standardization
All raster maps were first processed in ArcGIS to ensure geometric and coordinate consistency prior to clipping it with the sentinel-2 file on python.
Shapefile layers from processed raster maps were prepared into map layouts
Sentinel-2 JP2 files [Red (Band 4) and NIR bands (Band 8)] from Copernicus satellite was downloaded, unzipped and uploaded to python.
Querying into Python Library
Low cloud Sentinel-2 JP2 files was downloaded from Copernicus data archive and unzipped to extract the needed bands.
All required python Libraries were imported to a cell before running.
Shapefile and the Jp2 files are uploaded and their path copied and pasted in the cell to be read by the python operating system.
Clipping Ezza North Shapefile with the downloaded satellite data.
Followed by NDVI [(NIR – Red) / (NIR + Red)], First color composition (FCC) calculations, summary statistics and plots
Classification of vegetation change (Loss, Stable, Gain) maps.
Plotting of Final Thematic Maps.
RESULTS/OUTPUTS
➢ Non-Definitive Vegetative Index


The analysis of urban green cover using NDVI reveals the following changes in Ezza North LGA between 2023 and 2024:
Low Vegetation /Urban areas increased significantly from 12,691 ha (44.2%) in 2023 to 15,732 ha (54.8%) in 2024 — an increase of 3,041 hectares.
Moderate Vegetation decreased from 15,971 ha (55.6%) in 2023 to 12,978 ha (45.2%) in 2024 — a loss of 2,993 hectares of vegetation.
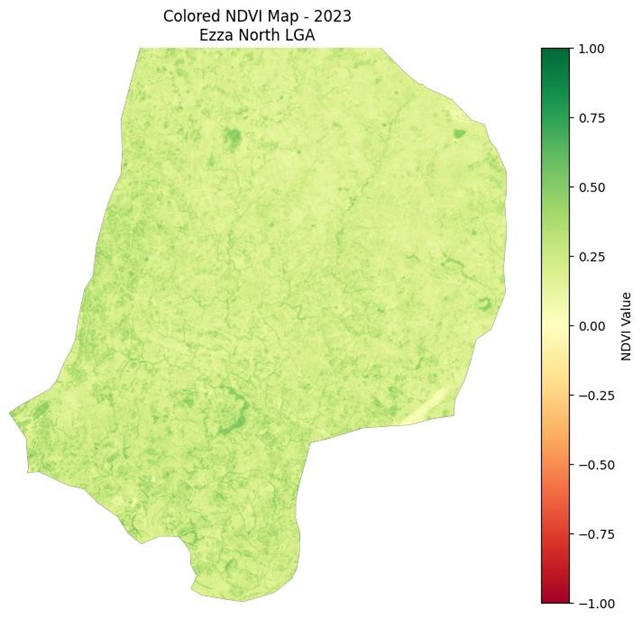
High / Dense Vegetation almost disappeared, dropping from 48.48 ha (0.2%) to just 0.25 ha (0.0%). Figure 2 and 3 depicts the colored NDVI Map for the two (2) years.

➢ False Colour Composite Images:
False Colour Compositions were generated for both dates. In FCC images, healthy vegetation appears in Yellowish-Orange color for 2023, and Light-green for 2024.


NDVI Thematic Map:
The NDVI map for December 2023 shows vegetation density across Ezza-North, with higher values (greener areas) portraying a healthier vegetation.
Urban Green Cover Change Intelligence Map:
The change detection map reveals little red areas, indicating significant vegetation loss between January 2023 and December 2024.

DISCUSSION OF VEGETATIVE CONDITIONS
There was a decline in vegetation cover in Ezza North LGA from 2023 to 2024. Moderate vegetation areas were largely converted into low vegetation or builtup land, resulting in a net loss of nearly 3,000 hectares of vegetated land. Dense vegetation, which was already very minimal, virtually disappeared. The reduction in NDVI (from 0.224 to 0.200) confirms the ongoing degradation in vegetative conditions of the area. However, the overall vegetation status remains in the low-to moderate category, and are likely caused by increasing Agro activities, urban development and general Land Usage.
CONCLUSION AND RECOMMENDATIONS
Open-source Python libraries (Rasterio, NumPy, and GeoPandas) can be used successfully for automated urban vegetation monitoring.
In addition, Ezza North LGA experienced a moderate loss of green cover between 2023 and 2024, mainly through the conversion of moderate vegetation into low vegetation or non-vegetated surfaces. Urgent attention to vegetation conservation, reforestation, or sustainable land-use planning is recommended to prevent further degradation of the limited green cover in the area.
It is highly recommended that there should be a stronger urban greening policy, tree planting campaigns, and protected green zones to reverse the current trend while promoting sustainable urban development in Ezza-North.


Comments