.png)
Geospatial Automation & Development Program for Real-World GIS Careers
- Satyaranjan Swain
- 4 days ago
- 6 min read

About the Training Program
The Geospatial Automation and Development Program focuses on one goal. Turn your domain knowledge into practical, data-driven GIS skills.
This is not a basic GIS course. You work on tools, automation, and real workflows used in industry which will be an effective upgrade for your GIS career.
What you will learn
Core GIS tools
Work on ArcGIS Pro and QGIS
Build end-to-end spatial analysis workflows
Handle raster and vector datasets
Satellite data analysis
Use Google Earth Engine
Process large-scale datasets
Perform time-series analysis
GIS programming and automation
Use Python with ArcPy, GeoPandas, Rasterio
Automate repetitive GIS tasks
Build scalable workflows
Spatial database management
Work with PostgreSQL and PostGIS
Store, manage, and query large geospatial datasets
What makes this program different
You don’t just learn tools, you solve real problems
You work on real datasets, not sample files
You focus on automation, not manual mapping
You build skills aligned with current industry demand
Who should take this program
Students from GIS, Urban Planning, Environment, Agriculture
Professionals who want to move into GIS roles
Anyone who wants to work with spatial data at scale
GIS is not limited to mapping. It is a decision-making system.
You take real-world problems. You attach location to data. Then you analyze patterns, risks, and opportunities.
This is where most students struggle. They know the theory. They don’t know how to apply it using tools, automation, and real datasets.
>>The following sections show how GIS is used across key domains. Each use case connects directly to the skills you learn in this program.
In Agriculture (Smart Farming by using AgriTwin)
For Agriculture or Agronomy students, this program aligns directly with how modern farming and agri-research operate. You’re giving them tools used in precision agriculture, crop analytics, and large-scale monitoring.
1.Smart Crop Monitoring & Prediction
You monitor crop health and predict outcomes using data-driven models.

What you will do:
Detect crop diseases using leaf images
Identify healthy and infected plants
Predict crop yield before harvest
Analyze weather impact on crop growth
Monitor field conditions in real time
Tools:
Python (GeoPandas, TensorFlow, OpenCV)
GIS (ArcGIS Pro, QGIS)
Weather APIs and satellite data
Example:
Detect leaf disease in coffee plantations and alert farmers early
Predict coconut yield based on weather and farm inputs
Monitor ginger crop health and reduce disease spread
2. Climate-Based Crop Intelligence
You use climate and environmental data to improve farming decisions.

What you will do:
Track rainfall, temperature, and humidity trends
Identify drought and water stress conditions
Provide early warnings for crop risks
Support irrigation planning
Tools:
Google Earth Engine
Remote sensing data
Python-based analytics
Example:
Detect water stress in coconut farms and guide irrigation
Analyze seasonal weather trends for yield prediction
Alert farmers about unfavorable climate conditions
3. Multi-Crop Yield Prediction System
You build scalable models for different crops and regions.

What you will do:
Estimate production before harvest
Customize models for different crops
Use historical and real-time data
Support market and income planning
Tools:
Machine Learning models
PostgreSQL + PostGIS
Data analytics frameworks
Example:
Predict potato yield for seasonal planning
Estimate ginger production and plan labor needs
Adapt models for banana, rice, and other crops
4. Mobile Application for Smart Farming
You deliver farm insights directly to users through a mobile application.


What you will do:
Build mobile apps for crop monitoring
Enable yield forecasting on mobile
Detect crop diseases using image upload
Provide real-time alerts and recommendations
Monitor crop stress and field conditions
Tools:
Flutter / React Native
Python APIs (ML models integration)
Cloud services (Firebase / AWS)
GIS and remote sensing data
Example:
Farmers upload leaf images to detect diseases instantly
Mobile dashboard shows predicted yield before harvest
Alerts sent for water stress and climate risks
Field-level insights accessible anytime on phone
In Urban Planning (Use Case)
GIS in urban planning works when you tie spatial data to decisions. Here are practical, field-level scenarios you can use or present.
1. Land Use Planning and Zoning


You map how land is used and enforce zoning rules.
What you will do:
Overlay satellite imagery with cadastral parcels
Classify land into residential, commercial, industrial
Detect illegal land use changes
Tools:
ArcGIS Pro, QGIS
Example:
Identify encroachment in green zones in Bangalore
Support master plan revisions with updated land use map
2. Infrastructure Planning and Site Selection


You decide where to build roads, schools, hospitals.
What you will do:
Run multi-criteria analysis
Use layers like population density, road access, land cost
Rank suitable locations
Key technique:
Weighted overlay analysis
Example:
Select best locations for new metro stations based on demand and connectivity
3. Traffic and Transportation Management


You optimize movement across the city.
What you will do:
Map traffic density using GPS data
Identify congestion hotspots
Optimize routes and signals
Tools:
ArcGIS Network Analyst
Example:
Reduce travel time by redesigning bus routes
Plan flyovers where congestion persists
4. Utility and Asset Management


You manage water, electricity, drainage networks.
What you will do:
Map pipelines, cables, manholes
Track asset condition and maintenance
Example:
Detect leak-prone water pipelines
Plan maintenance schedules based on spatial risk
5. Disaster Management and Risk Planning


You prepare cities for floods, earthquakes, heatwaves.
What you will do:
Create hazard maps using elevation and rainfall data
Identify vulnerable zones
Plan evacuation routes
Example:
Flood risk mapping in low-lying urban areas
Restrict construction in high-risk zones
6. Smart City and Urban Monitoring


You monitor city performance in real time.
What you will do:
Integrate IoT data with GIS
Track air quality, traffic, waste collection
Example:
Real-time dashboards for municipal control rooms
Predict urban growth using time-series satellite data
7. Environmental Planning


You balance development with sustainability.
What you will do:
Map green cover and pollution levels
Analyze urban heat islands
Example:
Identify areas lacking parks
Plan green corridors to reduce heat
8. Population and Demographic Analysis


You understand where people live and how cities grow.
What you will do:
Map population density
Analyze migration patterns
Example:
Plan schools and hospitals in high-growth zones
Allocate resources based on demand
In Environmental Management (Use Case)
For an Environmental Management student, this course is a strong fit. These are the exact tools used in environmental GIS roles.
1. Environmental monitoring using satellite data


What you will do:
Track deforestation, water body shrinkage, land degradation
Compare multi-year satellite data
How this course helps:
Use Google Earth Engine for large-scale analysis
Run time-series change detection
Example:
Detect forest loss trends in Karnataka over 10 years
2. Environmental impact assessment (EIA)


What you will do:
Assess impact of roads, industries, mining projects
How this course helps:
Use ArcGIS Pro and QGIS
Perform buffer, overlay, proximity analysis
Example:
Identify villages affected within 5 km of an industrial plant
3. Water resource management


What you will do:
Study watersheds, groundwater zones, river systems
How this course helps:
Work with DEM data and hydrology tools
Automate analysis using Python
Example:
Identify groundwater recharge zones
4. Pollution analysis and mapping


What you will do:
Map air, water, and soil pollution
How this course helps:
Use spatial interpolation and analysis in QGIS
Store and manage data using PostGIS
Example:
Create PM2.5 concentration maps for cities
5. Climate change and sustainability analysis


What you will do:
Study climate risks, heat islands, vegetation loss
How this course helps:
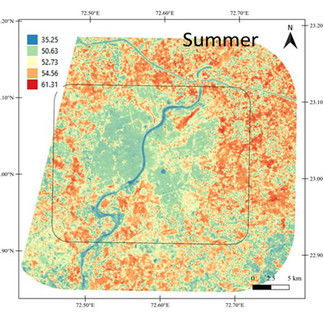
Use NDVI, LST analysis in Google Earth Engine
Example:
Identify heat-prone zones in urban areas
6. Wildlife and biodiversity conservation


What you will do:
Map habitats, corridors, conflict zones
How this course helps:
Combine spatial layers and automate analysis using Python
Example:
Identify elephant corridors and conflict hotspots
What this will mean for your career?
After your course, they can target roles like:
Environmental GIS Analyst
Remote Sensing Analyst
Climate Data Analyst
GIS Developer (environment-focused projects)
Conclusion
GIS is no longer a support tool. It drives decisions across industries.
Urban planning needs data-backed zoning and infrastructure design.
Environmental management depends on monitoring, risk analysis, and sustainability planning.
Agriculture is shifting toward precision, satellite monitoring, and yield optimization.
Across all these domains, one gap is clear.
Domain knowledge exists
Technical execution is missing
This is where most students and professionals get stuck.
The Geospatial Automation & Development Program bridges that gap.
You work with real datasets
You learn automation using Python
You handle satellite data at scale
You build workflows used in actual projects
If you want to move into GIS roles, technical depth decides your growth.
Manual mapping is not enough
Basic GIS skills are not enough
You need automation, data handling, and analytical capability.
This program gives you that foundation.
If you are serious about building a career in GIS, this is the step that moves you from theory to real-world execution.


Comments