.png)
Mastering Interpolation in ArcGIS Pro: Techniques, Tools, and Applications
- Nazna Nazar | AGSRT Student | Intern

- Jan 17, 2025
- 3 min read
Updated: Mar 5, 2025
1. Introduction to Interpolation
1.1 What is Interpolation?
Interpolation is a method used to estimate unknown values at specific locations based on known data points. Imagine you're collecting rainfall data from two nearby weather stations and want to predict the rainfall in a location between them; similarly, in GIS, interpolation helps to estimate rainfall values across a geographical area.


2. Importance of Interpolation in GIS
In Geographic Information Systems (GIS), interpolation is crucial for creating smooth surface models from discrete data points. It helps in environmental modelling, weather predictions, and even city infrastructure planning, giving us a clearer picture of our landscapes and allowing us to make informed decisions based on spatial data.
3. Interpolation Methods in ArcGIS
3.1 Global vs. Local Interpolation Methods
Interpolation methods generally fall into two categories: Global methods, which utilize all available data points to make predictions, and Local methods, which focus only on surrounding points. The method you choose should be based on the specific nature of your data and the context of your analysis.
3.2 Common Interpolation Techniques
3.2.1 Inverse Distance Weighting (IDW)
IDW is simple and intuitive. It assumes closer points have a greater influence on the unknown value than those farther away. Use IDW when you have a reasonably dense set of measurements and want to model gradual changes over a region.
3.2.2 Kriging
Kriging is a more advanced statistical technique that not only takes data into account but also considers the spatial arrangement of the data points. It's particularly useful for data that may contain uncertainty or variance.
3.2.3 Spline Interpolation
This method uses mathematical functions to create a smooth curve through the data points. Spline interpolation is excellent for tasks like creating elevation models where smoothness is desired.
4. Implementing Interpolation in ArcGIS Pro.
4.1. Open GIS Software
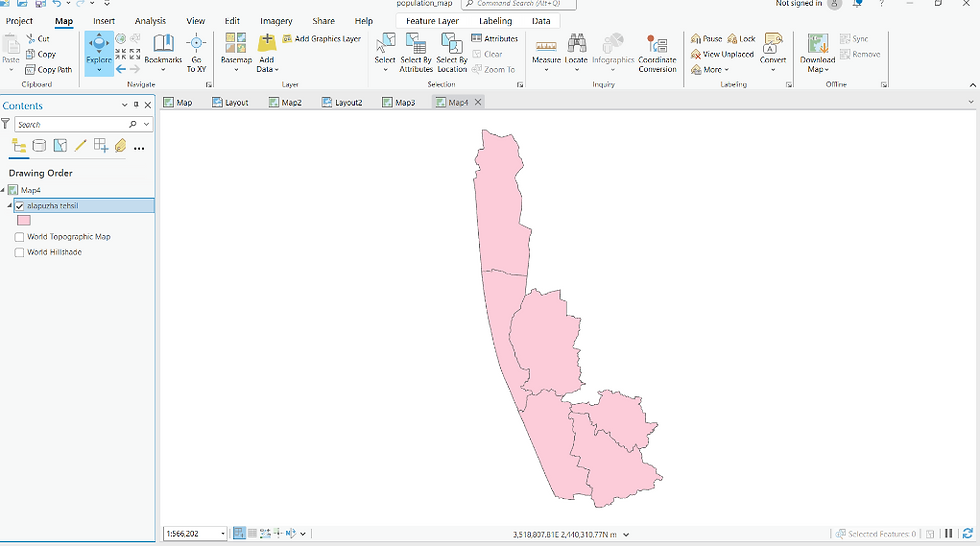
4.2. Add the Shapefile of Alappuzha District.
4.3. Add the CSV File Containing Sex Ratio and Child Sex Ratio Data.
4.4. Join the Data (Sex Ratio and Child Sex Ratio).
4.5.Create Centroids from QGIS.
4.6.Perform IDW Interpolation.


4.2 Working with ArcGIS Tools for Interpolation
4.2.1 Geostatistical Analyst Tools
These tools in ArcGIS Pro allow for advanced statistical modelling of your data. They provide options for conducting a variety of interpolation methods, making it easier to analyze complex relationships.
4.2.2 Spatial Analyst Tools
Spatial Analyst provides tools to perform raster-based calculations, including interpolation. This is ideal for continuous data analysis, such as creating temperature or elevation maps.
4.2.3 3D Analyst Tools
3D Analyst tools allow you to visualize your data in three dimensions. This is particularly useful for understanding the topography or underground features through interpolate
4.3 Fine-Tuning Interpolation Parameters
Once you’ve selected a method, it’s time to adjust parameters such as search radius and weighting factors. These adjustments can significantly impact the results, so it’s advisable to experiment with settings to find the best fit for your data.

Conclusion
Understanding interpolation in ArcGIS equips you with powerful tools to analyze data and make informed geographical decisions. Familiarizing yourself with the different methods, their applications, and how to implement them in ArcGIS is essential for anyone working with spatial data. Whether you're monitoring environmental changes or planning urban spaces, mastering interpolation will enhance your ability to understand and visualize the world around you. The insights gained from spatial analysis can lead to better decision-making and improved outcomes in various fields.


Comments