.png)
Indices-Based LULC Classification: With Regional Growth Segmentation
- REMI BRINTHA M R

- Jan 10, 2025
- 5 min read
Introduction
The growth of a society totally depends on its social and economical development. LULC maps play a significant and prime role in planning, management and monitoring program at local, regional and national levels. This type of information, on one hand, provides a better understanding of land utilization aspects and on the other hand, it plays an important role in the formation of policies and program required for development planning. For ensuring sustainable development, it is necessary to monitor the on going process on land use/land cover pattern over a period of time. In order to achieve sustainable urban development and to check the haphazard development of towns and cities, it is necessary that authorities associated with the urban development generate such planning models so that every bit of available land can be used in most rational and optimal way. This requires the present and past land use/land cover information of the area. LULC maps also help us to study the changes that are happening in our ecosystem and environment.
Land Use Land Cover (LULC)
Land cover refers to the surface cover on the ground like vegetation, urban infrastructure, water, bare soil etc. Identification of land cover establishes the baseline information for activities like thematic mapping and change detection analysis. Land use refers to the purpose the land serves, for example, recreation, wildlife habitat, or agriculture Land Use / Land Cover (LULC) generally refers to the categorization or classification of human activities and natural elements on the landscape within a specific time frame based on established scientific and statistical methods of analysis of appropriate source materials.
There are lot of methods available to prepare LULC map,
Supervised classification
Unsupervised classification
Decision tree classification
Object based classification
Regional Growth Segmentation
But preparing LULC map by these methods need proper subject oriented knowledge. Satellite image is the one, which used by the several applications of several department, the one who without any prior knowledge of spectral behavior of different materials Regional growth segmentation method is used to prepare LULC map. This method involves spectral indices.
Regional Growth Segmentation
The regional growth method makes the pixels together to form a region. The method requires first selecting a seed pixel and then merging the similar pixels around the seed pixel into the region where the seed pixel is located by using band ratio method. In this study we use indices such as NDVI, NDWI, NDBI, BSI.All indices ranges from -1 to +1. For example, when you have negative values, Most likely conflict of index. On the other hand, if you have a index value close to +1, there’s a high possibility that there are mentioned index.
NDVI
Normalized Difference Vegetation Index (NDVI) is simply a ratio of near infrared (NIR) reflectivity minus red reflectivity (VIS) over NIR plus VIS.
NDVI=(NIR-VIS)/(NIR+VIS)
The basic principle of NDVI relies on the fact that, due the spongy layers found on their backsides, leaves reflect a lot of light in the near infrared, in stark contrast with most non-plant objects. When the plant gets dehydrated or stressed, the spongy layer collapses and the leaves reflect less NIR light, but the same amount in the visible range. Thus, mathematically combining these two signals can help differentiate the plant from the non-plant and healthy plant from sickly plants.
NDVI always ranges from -1 to +1. For example, when you have negative values, Most likely it’s water. On the other hand, if you have a NDVI value close to +1, there’s a high possibility that there are dense green leaves but when NDVI is close to zero, it means there are no green leaves and it could even be an urbanized area.
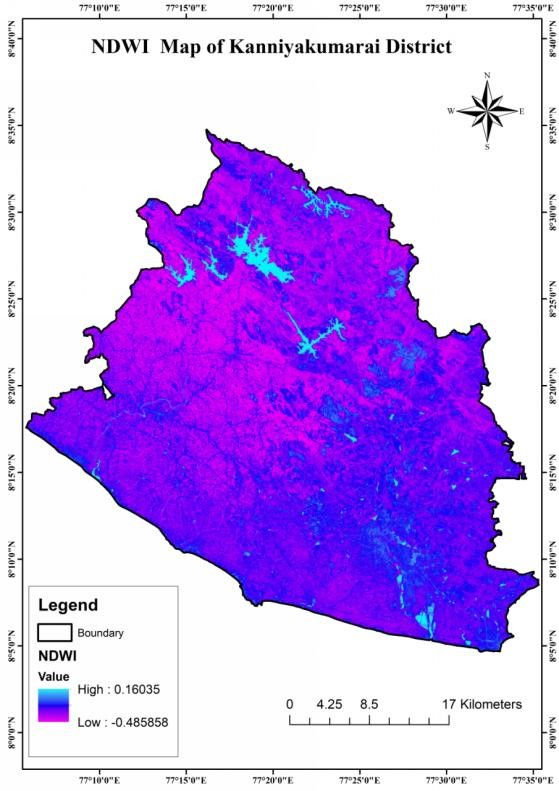
NDWI
The Normalized Difference Water Index (NDWI) is used to highlight open water features in a satellite image, allowing a water body to “stand out” against the soil and vegetation. The NDWI, on the other hand, is calculated using the GREEN-NIR (visible green and near-infrared) combination, which allows it to detect subtle changes in water content of the water bodies.
NDVI=(GREEN-NIR)/(GREEN+NIR)
Values of water bodies are larger than 0.5. Vegetation has much smaller values, which results in distinguishing vegetation from water bodies easier. Built-up features have positive values between 0 and 0.2.
The NDWI values correspond to the following ranges:
0,2 – 1 – Water surface,
0.0 – 0,2 – Flooding, humidity,
-0,3 – 0.0 – Moderate drought, non-aqueous surfaces,
-1 – -0.3 – Drought, non-aqueous surfaces
NDBI
The Normalized Difference Built-up Index (NDBI) is a remote sensing index used to identify urban and built-up areas from satellite imagery. It leverages the difference between the reflectance values in the Near-Infrared (NIR) and Shortwave Infrared (SWIR) spectral bands, where built-up areas tend to have higher reflectance in the SWIR band and lower in the NIR band. This index helps in urban planning, monitoring urban sprawl, and analyzing the impact of urbanization on the environment. The NDBI indices range from -1 to 1.
NDBI = (SWIR – NIR)/(SWIR + NIR)
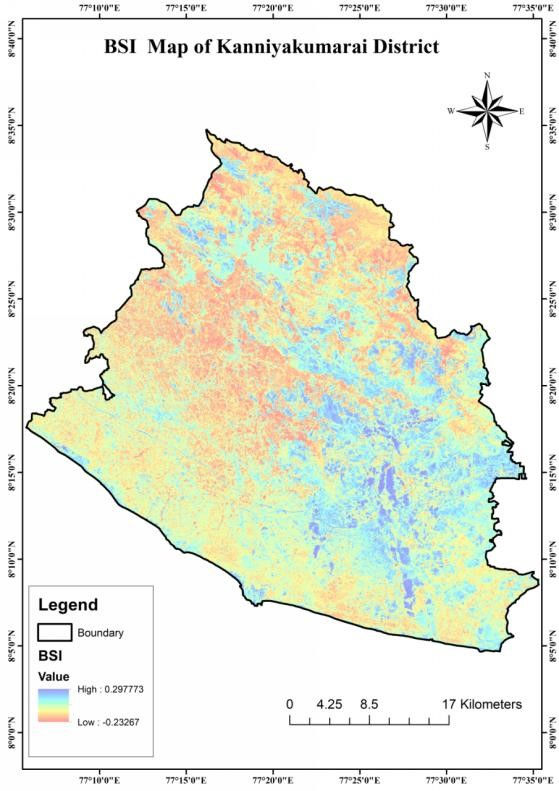
BSI
Bare Soil Index (BSI) is a numerical indicator that combines blue, red, near infrared and short wave infrared spectral bands to capture soil variations. These spectral bands are used in a normalized manner. The short wave infrared and the red spectral bands are used to quantify the soil mineral composition, while the blue and the near infrared spectral bands are used to enhance the presence of vegetation.
BSI = ((Red+SWIR) – (NIR+Blue)) / ((Red+SWIR) + (NIR+Blue))
Data
We can use multi spectral optical data for this study. Landsat 9 satellite data was downloaded from USGS website. Landsat 9 is designed to simultaneously image four visible spectral bands, one near-infrared spectral band, three shortwave-infrared spectral bands at 30 m (98 ft) spatial resolution, plus one panchromatic band at 15 m (49 ft) spatial resolution, and two thermal bands at 100 m (328 ft) spatial resolution.

Methodology
I prepared LULC map of Kanniyakumari district, Tamilnadu by Regional Growth Segmentation method.
Downloaded required satellite data sets of study area was downloaded from USGS website and administrative boundary files are downloaded from SOI - Survey of India website.
I took Level 2 data set of Landsat, so don’t need to do atmospheric correction, and don’t need to convert DN value to Top of Atmosphere Reflectance.
By using Extract by mask tool from the ArcGIS software, clip the study area of given data was done
By using Raster calculator tool, indices are calculated from following Band formula
NDVI = float (Band 5-Band 4)/float (Band 5+Band 4)
NDWI = float (Band 3-Band 5)/float (Band 3+Band 5)
NDBI = float (Band 6-Band 5)/float (Band 6+Band 5)
BSI = (float (Band 6-Band 4)-float (Band 5+Band 2))/(float (Band 6-Band 4)+float (Band 5+Band 2))


By using reclassification tool , revalue the feed value (0-1) into new values And below zero into no-data. Now we get the classes of Vegetation, water-body, settlement,bare soil.
After the raster to vector feature conversion for each indices done And final LULC map was prepared by merging all layer into one.

Limitations
Accuracy is not much good compare with supervised classification
Settlement and Bare soil may be miss-classified in several regions
Basic GIS Software Knowledge is required
Conclusion
Present study has be done for analyzing the LULC classification of study area by Indices based Regional growth segmentation method. This method was useful for those who don’t know the spectral reflectance basics, but it has some limitation itself like miss-classification, limited indices to calculate main LULC classes.


Comments