
.png)

1. Introduction
1.1 Background
Urbanization has been a key factor in altering the microclimate of cities, leading to the Urban Heat Island (UHI) effect, where urban areas exhibit higher temperatures than their rural surroundings. This phenomenon is primarily driven by the conversion of natural landscapes into built-up areas, reduced vegetation cover, and increased surface materials that absorb and retain heat (Oke, 1982; Voogt & Oke, 2003). Jalna, located in Maharashtra, has experienced rapid urbanization, making it an ideal case study for examining the impact of land use changes on UHI (Sundaresan, 2016). Studies have consistently demonstrated the relationship between LULC changes and increased surface temperatures, with urban areas exhibiting a notable decline in vegetation and a corresponding rise in built-up regions (Rizwan, Dennis, & Liu, 2008).
1.2 Objectives
-
Conduct a comparative LULC analysis of Jalna for the years 2012-2013 and 2020-2021 using remote sensing data.
-
Assess vegetation and urban expansion using NDVI and NDBI.
-
Analyze the UHI effect by calculating LST from satellite imagery.
-
Explore the relationship between LULC changes and UHI intensity in Jalna
1.3 Study Area: Jalna, Maharashtra
Jalna is located in Maharashtra's semi-arid region, with significant population growth and urban expansion in recent years. Its geographic and climatic conditions, coupled with urbanization, make it highly susceptible to the UHI effect (Ramachandra, Setturu, & Bala Subrahmanya, 2015). With growing infrastructure, the city has seen a reduction in green spaces, exacerbating temperature increases (Guha, Govil, & Chopra, 2017).

[Fig No 1: Shows Study Area JALNA (MS)]
2. LITERATURE REVIEW
2.1 Urban Heat Island (UHI) Phenomenon
The UHI effect is a well-documented consequence of urbanization, where the replacement of natural surfaces with impervious ones leads to higher temperatures in urban centers compared to rural areas (Oke, 1982). Increased human activities, industrialization, and reduced vegetation contribute to this warming effect, often resulting in negative environmental and health impacts (Santamouris, 2015).
2.2 Land Use Land Cover (LULC) Changes
LULC changes have been extensively studied in environmental science to understand the impact of human activity on natural ecosystems (Turner et al., 2007). As cities expand, they often replace forests, agricultural lands, and other natural features with buildings and infrastructure, causing significant ecological shifts (Lambin & Geist, 2006). Remote sensing techniques have made it possible to monitor these changes over time, providing critical data for urban planning (Jensen, 2007).
2.3 Remote Sensing and GIS in UHI Studies
Remote sensing and GIS are crucial for studying the spatial distribution of UHI and land use changes (Rizwan et al., 2008). By leveraging satellite imagery, researchers can map temperature variations and correlate them with changes in urbanization (Voogt & Oke, 2003). These tools enable the identification of areas most affected by UHI and provide insights into mitigating its impacts through better urban design (Zhou et al., 2016).
3. Data and Methodology

4. Results and Analysis
4.1 LULC Changes (2012-2013 vs 2020-2021)
Between 2012-2013 and 2020-2021, Jalna's land use and land cover (LULC) changed significantly, with an increase in built-up areas and a decrease in vegetation cover. The supervised classification method was used to generate LULC maps, categorizing areas as vegetation, water bodies, built-up areas, etc.
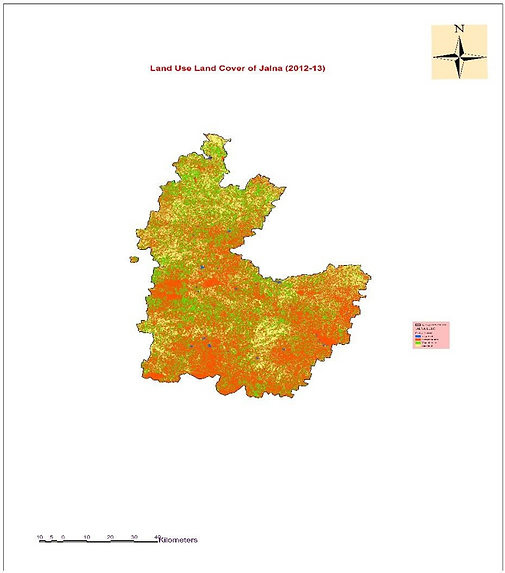
[Map: LULC maps for 2012-2013]

[Map: LULC maps for 2020-2021]
4.2 NDVI Trends and Vegetation Cover Changes
The Normalized Difference Vegetation Index (NDVI) was used to measure vegetation cover. NDVI values, which range from -1 to +1, showed a decline, indicating reduced vegetation between the two periods.
Formula:
NDVI= (NIR-R) / (NIR+R)
-
NIR represents the reflectance in the near-infrared band.
-
R represents the reflectance in the red band

[Map: NDVI maps for 2012-2013]

[Map: NDVI maps for 2020-2021]
4.3 NDBI (Built-up Area Expansion)
The Normalized Difference Built-up Index (NDBI) was calculated to identify built-up areas. Higher NDBI values were found in 2020-2021, indicating urban growth.
Formula:
NDBI= (Band 5-Band 4) / (Band 5+Band 4)

[Map: NDBI maps for 2012-2013]

[Map: NDBI maps for 2020-2021]
4.4 Land Surface Temperature (LST)
The LST was calculated from the thermal infrared bands of Landsat data. The increase in surface temperature from 2012-2013 to 2020-2021 was evident, especially in built-up areas, contributing to the Urban Heat Island (UHI) effect.
Formula:
a) Top of Atmosphere (TOA) Radiance: (TOA) = 0.00038*” B10.TIF”+0.1
b) Brightness Temperature (BT): BT=(K2/ (In (K1 / L)+ 1))-273.15
where:
> K1 = Band-specific thermal conversion constant from the metadata
(K1_CONSTANT_BAND_x, where x is the thermal band number).
>K2 = Band-specific thermal conversion constant from the metadata
(K2_CONSTANT_BAND_x, where x is the thermal band number).
L = TOA
Therefore, to obtain the results in Celsius, the radiant temperature is adjusted by adding the absolute zero (approx. -273.15°C).

[Map: TOA maps for 2012-2013]

[Map: TOA maps for 2020-2021]

[Map: LST maps for 2012-2013]

[Map: LST maps for 2012-2013 and 2020-2021]
5 Urban Heat Island (UHI) Effect
The Urban Heat Island (UHI) map is derived from the LST (Land Surface Temperature) analysis. This map showcases the temperature variations across Jalna, with a focus on comparing urban and rural areas. The LST maps for both 2012-2013 and 2020-2021 indicate that urban regions, particularly areas with high NDBI values, experience significantly higher surface temperatures compared to surrounding vegetative and rural regions with higher NDVI values.

[LST 2012-2013 & LST 2020 -2021]

[NDVI 2012-2013 & NDVI 2020 -2021]

[NDBI 2012-2013 & NDBI 2020 -2021]
Conclusion:
This project provided a detailed analysis of land use and land cover changes, vegetation reduction, urban expansion, and the Urban Heat Island (UHI) effect in Jalna, Maharashtra, over the periods 2012-2013 and 2020-2021. Using remote sensing and GIS tools, the study revealed significant urbanization and a corresponding decline in vegetation cover. The LULC maps indicated an increase in built-up areas, while the NDVI and NDBI results confirmed a reduction in green spaces and an expansion of urban zones.
The increase in Land Surface Temperature (LST), particularly in areas with high urban density, illustrated the intensification of the UHI effect, with urban areas showing much higher temperatures than rural regions. The correlation between rising LST values and reduced vegetation was evident, emphasizing the environmental impacts of urban growth.
Overall, the study underscores the importance of sustainable urban planning to mitigate these negative impacts. The findings provide valuable insights for policymakers and urban planners to develop strategies that address the growing urbanization, improve green cover, and reduce the UHI effect in Jalna.
Suggestions
-
Promote Green Infrastructure: Invest in urban green spaces, such as parks and green roofs, to reduce surface temperatures and improve air quality.
-
Sustainable Urban Planning: Implement land-use policies that balance development with natural preservation, reducing urban sprawl and protecting rural areas.
-
Increase Tree Canopy: Enhance urban forestry programs to plant trees in heat-prone areas, which can provide shade, reduce temperatures, and increase biodiversity.
-
Effective Water Management: Introduce sustainable water management systems like permeable pavements and rain gardens to manage runoff and help cool urban environments.
-
Community Engagement: Raise awareness among the public about the importance of maintaining green spaces and the role they play in reducing urban heat.
-
Continuous Monitoring: Establish regular monitoring systems using GIS and remote sensing to track land use, vegetation health, and temperature changes for informed decision-making.
-
Collaborative Policies: Foster collaboration between local government, NGOs, and community organizations to create policies that mitigate urban heat and encourage environmental sustainability.
-
Research and Innovation: Encourage further research on climate change impacts, urbanization, and sustainable solutions using advanced technologies like GIS and remote sensing.
Reference
-
Voogt, J. A., & Oke, T. R. (2003). "Thermal remote sensing of urban climates." Remote Sensing of Environment, 86(3), 370-384. o This reference provides a foundational understanding of urban heat island effects and the role of remote sensing in urban climate studies.
-
Weng, Q. (2009). "Thermal infrared remote sensing for urban climate and environmental studies: Methods, applications, and trends." ISPRS Journal of Photogrammetry and Remote Sensing, 64(4), 335-344.
-
This study explains the methodologies for detecting urban heat islands using thermal infrared remote sensing and is highly relevant to LST analysis.
-
-
Oke, T. R. (1982). "The energetic basis of the urban heat island." Quarterly Journal of the Royal Meteorological Society, 108(455), 1-24.
-
This classic paper discusses the physical processes contributing to the UHI effect, which is central to understanding temperature variations in urban areas.
-
-
Weng, Q., Lu, D., & Schubring, J. (2004). "Estimation of land surface temperature–vegetation abundance relationship for urban heat island studies." Remote Sensing of Environment, 89(4), 467-483. o The relationship between NDVI, NDBI, and LST is explored in this study, relevant to the analysis of vegetation and urban expansion.
-
Zhao, Z., & Zhang, Y. (2013). "Remote sensing of urban heat islands: Progress, challenges, and perspectives." Remote Sensing, 5(10), 18721906.
-
This reference provides an overview of the progress in UHI detection and challenges, especially in using LST for urban heat analysis.
-
-
Landsat 8 Science Data User Handbook (2020). NASA.
-
This is a comprehensive guide on using Landsat data for remote sensing analyses like LST, NDVI, and NDBI, central to this project’s data analysis.
-
-
Taha, H. (1997). "Urban climates and heat islands: albedo, evapotranspiration, and anthropogenic heat." Energy and Buildings, 25(3), 99-103. o This paper explores the factors influencing the UHI effect, including urbanization, surface albedo, and vegetation loss.
These references provide a solid basis for the methodologies, tools, and frameworks used in this study for analyzing the urban heat island effect and land cover changes in Jalna.