.png)
Mapping Streetlights offline with Qfield & field maps: A real-world workflow for Indian urban surveys
- Nithin B R

- Jul 3, 2025
- 4 min read
Updated: Dec 10, 2025
Introduction
Urban infrastructure is the invisible backbone of every city and streetlights are one of the most critical yet often neglected components. Whether it’s improving public safety or reducing energy waste, managing streetlight data requires accurate ground-level information.
In this blog, we go beyond theory by testing both tools through a hands-on streetlight inventory survey conducted in my own neighborhood. Though a small-scale example, it realistically demonstrates how these tools can handle offline workflows, smart form design, and field-level challenges making this a practical, story-based guide suitable for real-world urban infrastructure projects.
Why Streetlight Mapping?
Streetlights are highly visible and evenly distributed assets — making them ideal for testing field data collection tools. They provide enough variety (different types, statuses, heights) to validate your form design, while still being simple enough to cover within a day.
Our aim:
Map a few street lights in a lane.
Record their location, type (LED, halogen, sodium), condition (working/not working), and photo evidence.
Do this completely offline using both QField and Field Maps.
Preparing the Project:
Form Design & Setup QField:
We started in QGIS, creating a point layer named street_lights. Fields included:
Pole_ID: Text
Type: Value map (LED, Sodium, Halogen)
Condition: Drop-down (Working, Not Working)
Photo: Attachment
Using the Attribute Form tab, we made “Pole ID” required and “Condition” a dropdown. We also enabled the “Attachment” widget to take photos on-site. The use of value maps allowed us to keep responses consistent and avoid typing errors.
ArcGIS Field Maps:
We opened Field Maps Designer and configured a feature layer with the same fields. The designer tool allowed quick drag-and-drop of fields, assigning default values, grouped sections, and required status. We ensured that photo attachments were mandatory for each entry, as the field was already available by default.
Lesson Learned:
Field Maps makes setup quicker, but QField offers deeper control via QGIS — especially for conditional logic or styling.
On-Ground Survey: The Experience
QField Workflow (Offline)
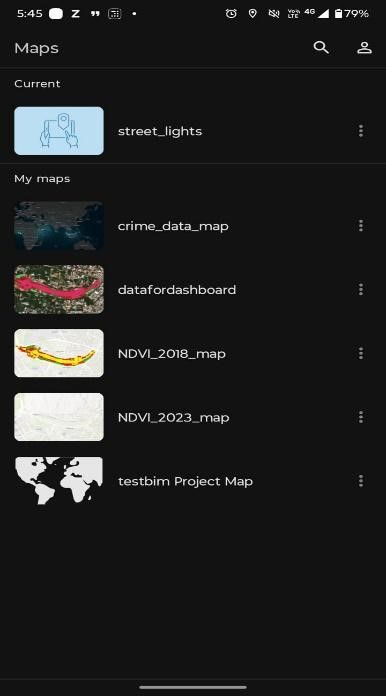
Opened the QField mobile app and logged into QFieldCloud.
Downloaded the packaged project, which was prepared in QGIS using QField Sync.

Enable digitizing mode from the options available at the top left to start capturing poles.
For each streetlight, lock co-ordinate cursor to the position and click on the green button to add a new point at the actual location.

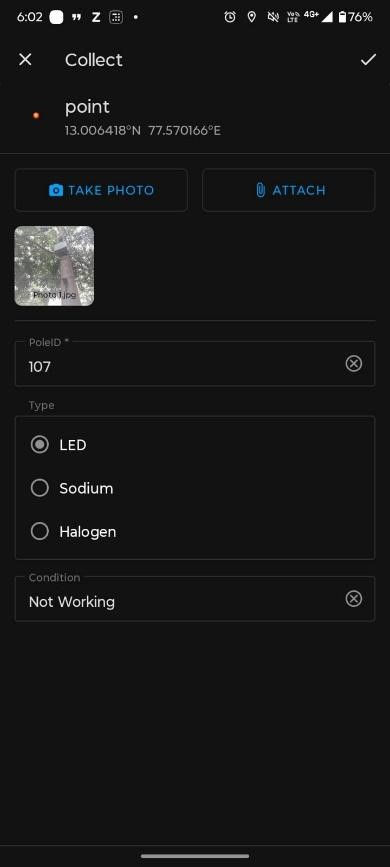
The form automatically opened — displayed fields like Pole ID, Type, Condition and photo.
Entered details and captured a photo directly using the mobile device camera.

Repeated the process for all streetlights on the street.
Once done, sync data back to QFieldCloud by tapping the cloud icon and clicking on push changes.

ArcGIS Field Maps Workflow (Offline)
Opened Field Maps mobile app and open the map created using Field Maps Designer.
Walked along the street and used GPS to auto-detect location while adding points.
Tapped on the location mark and click on ‘+’ mark to add each streetlight location and opened the smart form.

Filled in the fields and captured a photo attachment for each streetlight.
Saved the record and repeated for all nearby poles.
After the survey, get back to ArcGIS Online and can check the points created.
Sync Logic: How Each Tool Handled Offline Workflow
QField Sync Summary:
Data was synced via QFieldCloud, pushing from mobile to cloud.
Back in QGIS, used “Prefer Cloud” option to pull field data into the main project in QfieldCloud Projects Overview. All attachments and attribute values loaded correctly in QGIS. Applied unique symbology to differentiate the status.
Blue diamond dots for working streetlights
Red diamond dots for non-working ones
This visual made it easy to identify problem areas at a glance and could be shared with local authorities or exported for reports.

Field Maps Sync Summary:
Data was stored and updated in the cloud automatically.
All features and photos appeared correctly in ArcGIS Online web maps and dashboards.
No data loss or sync issues — but preplanning the offline area was essential.

Key Takeaways from the Field
Appreciated dropdowns and photo widgets especially on crowded streets.
Auto timestamps helped us know exactly when each pole was visited.
In QField, the conditional form logic avoided entry errors and streamlined data collection.
Why This Matters for Indian Municipalities
Offline GIS Tools for Asset Mapping: Imagine scaling the process across an entire ward or town. Simple offline GIS tools allow municipal staff to map and manage streetlight assets without relying on constant network connectivity. This is especially important in areas with limited or no internet access.
Efficient Maintenance Planning: By filtering and identifying non-working streetlights, maintenance planning becomes much easier. Municipal teams can quickly prioritize repairs, allocate resources effectively, and ensure a faster response time to issues.
Data Storage and Access: The data collected is stored spatially, providing a solid foundation for informed decision-making. Once synced, it can be easily incorporated into dashboards or reports, offering real-time insights into the status of the streetlight network.
Bridging the Digital Divide: In cities and rural areas of India where digital infrastructure may be lacking, offline mobile GIS is not just a tech feature but a game-changer. It provides a cost-effective, scalable solution that enables municipalities to modernize asset management, even without full internet connectivity.
Improved Service Delivery: By implementing offline GIS tools, municipalities can enhance their ability to deliver better services to citizens, ensuring that infrastructure like streetlights is well-maintained and operational, improving safety and quality of life.
Conclusion
This hands-on survey helped us go deeper into form design and offline logic. Streetlight inventory, though simple, gave us insight into real field constraints and tool strengths.
QField and ArcGIS Field Maps each shine in their own way:
QField: perfect for open-source flexibility and form logic.
Field Maps: best when you need fast setup and ArcGIS integration.
The key is not the tool — it’s how well you design the workflow.
So next time you're walking down a lane and spot a broken streetlight, think of it as more than a bulb. Think of it as a data point — waiting to be mapped.
Experiences like these are exactly what we explore hands-on at AGSRT — where practical training meets real-world GIS challenges.


Comments