.png)
Forest Carbon Stock Analysis in Google Earth Engine
- IMPANA S V

- Mar 18
- 5 min read
Introduction
Carbon stock analysis helps estimate the amount of carbon stored in vegetation and soil and how it changes over time. Forest ecosystems play a major role in absorbing atmospheric carbon dioxide and storing it as biomass and soil organic carbon. Monitoring these carbon dynamics is essential for climate change studies, forest conservation strategies, and sustainable land management.
In this project, carbon stock and carbon sequestration were estimated for the Wayanad district using Google Earth Engine (GEE). Google Earth Engine allows researchers to process large volumes of satellite imagery and environmental datasets quickly using cloud computing.
The analysis focuses on forest areas and compares carbon stock between 2020 and 2025. By analyzing these two time periods, the workflow identifies areas where carbon storage has increased or decreased over time. The resulting maps help visualize spatial patterns of carbon storage and provide insights into ecosystem changes occurring within the region.
Data Collection
The analysis integrates multiple geospatial datasets available in Google Earth Engine:
• Sentinel-2 Surface Reflectance – used for calculating vegetation indices such as NDVI that indicate vegetation health and density.
• ESA WorldCover 2020 – used to identify land cover classes and isolate forest areas for focused analysis.
• OpenLandMap Soil Organic Carbon dataset – used to incorporate soil carbon information for a more complete understanding of carbon storage.
Combining these datasets allows the workflow to estimate both vegetation carbon and soil carbon components across the study area.
Forest Carbon Stock Analysis
The carbon stock analysis workflow involves several processing steps including satellite image filtering, vegetation index calculation, biomass estimation, and carbon stock computation. These steps were implemented using the Google Earth Engine environment to automate data processing and produce spatial outputs.
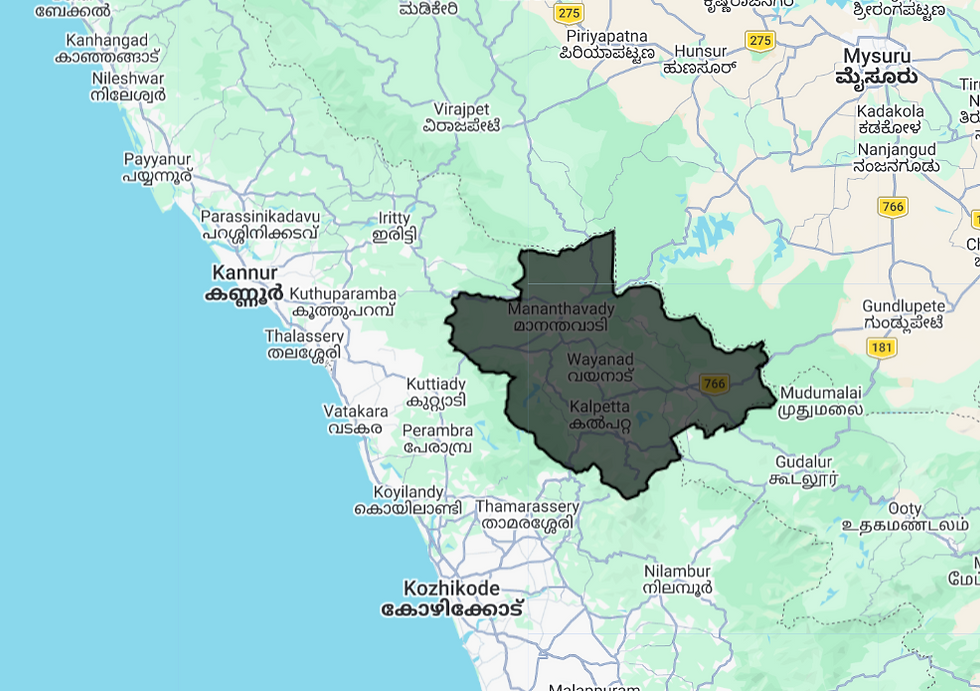
Step 1: Define AOI and Time Period
The first step was to define the Area of Interest (AOI) and select the time period for analysis.
In this project, the AOI corresponds to the Wayanad district boundary, which was imported into Google Earth Engine. This boundary ensures that all satellite imagery and calculations are restricted only to the study area.
Two separate time periods were selected:
• Year 2020
• Year 2025
These years allow comparison of carbon storage patterns across time and help identify areas where forest carbon has increased or decreased.
Step 2: Generate NDVI
To estimate vegetation density, Normalized Difference Vegetation Index (NDVI) was calculated using Sentinel-2 imagery.
Sentinel-2 images were filtered based on:
• Study area (AOI)
• Date range
• Cloud cover percentage
NDVI was then computed using the Red and Near Infrared bands of Sentinel-2 imagery.
NDVI formula:
NDVI = (B8 − B4) / (B8 + B4)
Where:
• B8 represents the Near Infrared band
• B4 represents the Red band
NDVI values range between −1 and +1, where higher values indicate denser and healthier vegetation. NDVI provides a strong indicator of vegetation productivity, making it useful for biomass estimation.
Step 3: Estimate Biomass
Vegetation biomass represents the total amount of living plant material present in an area. Since biomass is closely related to vegetation density, NDVI values can be used to approximate biomass.
In this workflow, biomass was estimated using a simplified empirical model:
Biomass = (NDVI − 0.2) × 80
This equation converts NDVI values into approximate biomass values.
Negative biomass values were removed to prevent unrealistic outputs, since negative NDVI values typically represent water bodies or non-vegetated surfaces.
The resulting biomass map represents the distribution of vegetation biomass across the study region.
Step 4: Estimate Carbon Stock
After biomass estimation, the next step is converting biomass into carbon stock.
Scientific studies often assume that about 47% of plant biomass consists of carbon. Using this carbon fraction, biomass values were converted into carbon stock.
Carbon Stock formula:
Carbon Stock = Biomass × 0.47
This step produces spatial maps representing the total amount of carbon stored in vegetation across the region.
Two maps were generated:
• Carbon Stock for 2020
• Carbon Stock for 2025
Comparing these maps helps visualize how forest carbon storage changes over time.
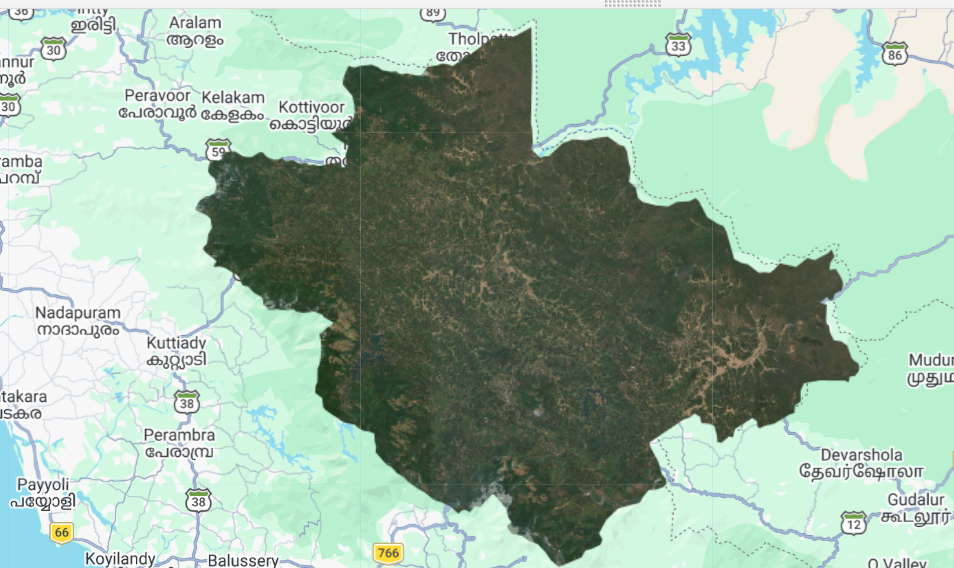
Carbon Stock 2020
The 2020 carbon stock map shows the distribution of stored carbon within vegetation across the Wayanad region for the base year.
Areas with dense forest cover typically show higher carbon stock values due to greater biomass accumulation.

Carbon Stock 2025
The 2025 carbon stock map represents the updated distribution of vegetation carbon. Comparing this with the 2020 map helps identify regions where carbon storage has increased or decreased due to vegetation growth, deforestation, or land-cover changes.

Step 5: Calculate Carbon Sequestration
Carbon sequestration represents the change in stored carbon over time.
To calculate this change, carbon stock values from 2020 were subtracted from those of 2025.
Carbon Sequestration formula:
Carbon Sequestration = Carbon 2025 − Carbon 2020
Positive values indicate areas where vegetation has absorbed more carbon, while negative values represent regions where carbon storage has decreased.
This step helps identify carbon gain and carbon loss patterns across the study area.
Carbon Sequestration
The carbon sequestration map highlights areas where forest carbon has increased or decreased between 2020 and 2025.
These spatial patterns help researchers understand forest growth, degradation, or recovery trends within the region.

Step 6: Calculate Total Sequestration
Since the output raster resolution is 10 meters, each pixel represents approximately 0.01 hectares.
To estimate the total carbon sequestration for the entire study area:
Pixel values were converted into carbon values per hectare.
All pixel values were summed across the AOI.
This produced an estimate of the total carbon sequestration in tons for the region.
Step 7: Forest-Only Analysis
To focus specifically on forest ecosystems, the ESA WorldCover 2020 dataset was used.
The workflow extracted only the forest land cover class and masked all other land cover types. This allowed carbon analysis to be performed exclusively for forested areas.
The resulting outputs included:
• Forest carbon stock maps
• Forest carbon sequestration maps
This approach provides a more accurate understanding of carbon dynamics within forest ecosystems.
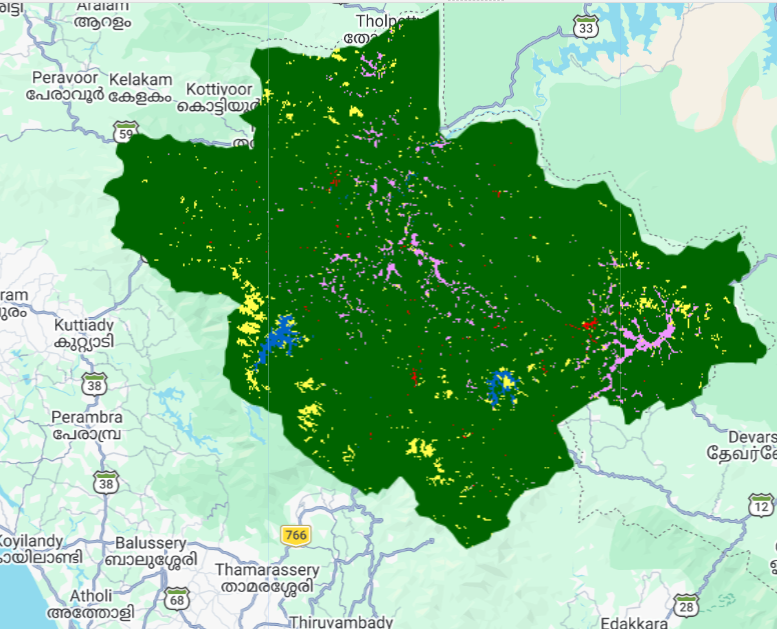
ESA WorldCover Layer
The ESA WorldCover dataset provides detailed land cover classification at a global scale. By using this dataset, forest areas can be separated from other land cover classes such as agriculture, built-up areas, and water bodies.
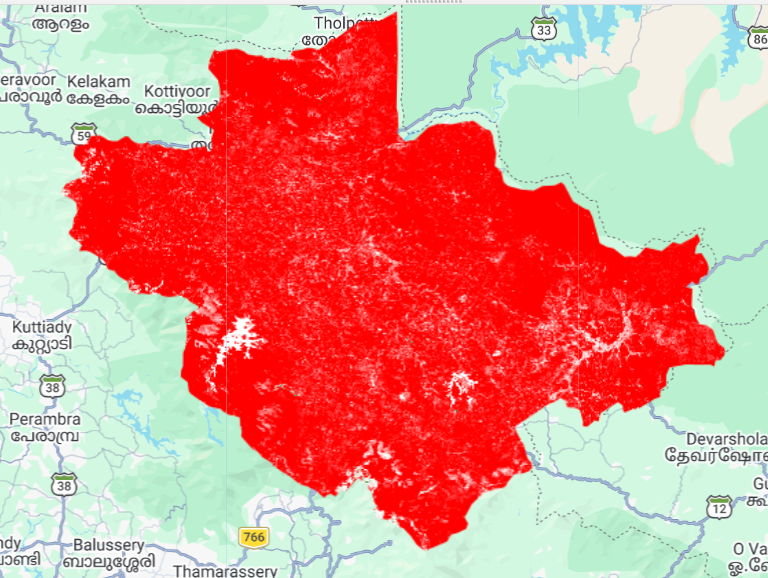
Forest Carbon 2025
This map displays carbon stock specifically within forest areas for the year 2025, helping visualize regions with high carbon density.

Forest Carbon Sequestration
The forest carbon sequestration map highlights changes in carbon storage within forests between 2020 and 2025. These results are particularly useful for forest management and climate mitigation strategies.

Step 8: Export and Visual Inspection
After completing the analysis, the final raster outputs were exported from Google Earth Engine to Google Drive.
These exported datasets can be used for:
• Further analysis in GIS software
• Report preparation
• Visualization and mapping
Additionally, visual inspection points were used to analyze carbon changes in selected hotspots within the study area.

Conclusion
This workflow demonstrates a practical method for estimating carbon stock and carbon sequestration using Google Earth Engine and open satellite datasets.
The forest-specific analysis highlights how carbon storage changes within forest ecosystems, while the broader workflow captures carbon dynamics across vegetation and soil components.
Such analyses are valuable for:
• Forest monitoring and conservation
• Climate change studies
• Carbon accounting and environmental research
• Sustainable land management planning
By combining satellite imagery, vegetation indices, and cloud-based processing tools, researchers and planners can efficiently monitor carbon dynamics and support data-driven environmental decision-making.


Comments