.png)
Emergency Response Planning with ArcGIS Pro Network Analysis
- Nithin B R
- Mar 4
- 3 min read
Using Closest Facility routes and Service Area coverage to evaluate hospital accessibility to accident locations.
Introduction: Network Analysis and its real-world uses
Network analysis in GIS models movement through a connected transportation network (roads), using real travel rules such as junction connectivity, one-way streets, turn restrictions, and time/distance costs. Unlike straight-line distance, network analysis answers practical questions like:
Which hospital can reach an accident location fastest?
What is the best route for an ambulance right now?
Which areas are reachable within 3, 6, or 10 minutes?
Where are response-time gaps and underserved zones?
Types of Network Analysis available in ArcGIS Pro
ArcGIS Pro (Network Analyst) provides multiple solvers for different problems:
Route – Best path between multiple stops.
Closest Facility – Finds the nearest facility (hospital) to an incident (accident) based on travel time/distance.
Service Area – Creates reachable regions (polygons/lines) within given time/distance thresholds.
OD Cost Matrix – Cost between many origins and destinations (accessibility at scale).
Location-Allocation – Identifies best locations for facilities based on demand.
Vehicle Routing Problem (VRP) – Optimizes multiple vehicles, stops, time windows, and capacities.
In this project, we focus on Closest Facility and Service Area to support emergency response planning.
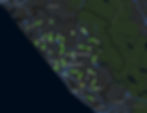
Dataset overview: Accidents and Hospitals
Before solving network problems, we need two core layers:
Accident locations (Incidents)
These are points representing where emergencies occurred or where response is required.
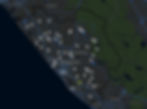
Hospital locations (Facilities)
These points represent hospital locations.

Part 1: Topology error correction in ArcGIS Pro (critical for accurate routing)
Network analysis is only as reliable as the road network. Even if roads look connected visually, tiny topology issues can prevent route solvers from finding valid paths or can produce unrealistic detours.
Common topology errors that break network results
Disconnected road endpoints (dangles)
Gaps between segments that should be connected
Overshoots and undershoots at intersections
Overlapping/duplicate road segments
Crossings without proper junction connectivity
Missing or invalid travel-time/speed values
Recommended correction workflow in ArcGIS Pro
Check and repair geometry (ensure clean line features).
Snap endpoints and integrate intersections so roads truly connect.
Validate topology rules (if using geodatabase topology).
Fix disconnected junctions (especially at complex intersections).
Remove duplicates and slivers that distort cost calculations.
Verify attributes (speed, travel time, restrictions, road class).
Rebuild the network dataset so the solver uses the corrected network.
Once topology is corrected, Closest Facility and Service Area outputs become dependable enough for planning and decision-making.
Part 2: Closest Facility analysis (Hospitals to Accident points)
Closest Facility is used when the main question is:“Which hospital can reach each accident point fastest, and what is the best route?”
Step-by-step workflow (Closest Facility)
Create a Closest Facility layer from Network Analyst.
Load Hospitals as Facilities.
Load Accidents as Incidents.
Set Impedance to Travel Time (minutes).
Enable realistic constraints such as:
one-way roads
turn restrictions
restricted roads (if any)
Solve and classify results into time-based response categories.
Output 1: Routes reachable within 3 minutes
These are the fastest-response routes, representing locations that can be served almost immediately. This is useful for identifying “high-confidence” service zones.

Output 2: Routes reachable within 6 minutes
This threshold is often used as a practical response window for many urban/semi-urban emergency planning contexts.

Output 3: Routes reachable within 10 minutes
This category typically highlights extended reach, showing which accidents are still serviceable but may require longer response times due to distance or network constraints.
What Closest Facility outputs provide
The best route an ambulance should take (real road-based)
Which hospital should respond to each accident
Identification of accidents falling outside critical time windows
Evidence for response-time improvements (more facilities, better roads, better dispatching)
Part 3: Service Area analysis (Coverage region from hospitals)
Service Area is used when the planning question is:“Which regions are reachable from hospitals within X minutes?”
This is extremely helpful for coverage mapping, gap analysis, and facility planning.
Step-by-step workflow (Service Area)
Create a Service Area layer from Network Analyst.
Load Hospitals as Facilities.
Set impedance to Travel Time (minutes).
Define breaks such as 3 minutes and 10 minutes.
Choose output:
overlapping polygons (per hospital) OR
dissolved polygons (combined coverage)
Output 1: Region reachable within 3 minutes
This map shows the core rapid-response coverage footprint of all hospitals.

Output 2: Region reachable within 10 minutes
This map shows the wider service footprint, which is useful for identifying coverage gaps and underserved zones.

What Service Area outputs provide
Clear, visual coverage zones by time threshold
Identification of areas outside reach (service gaps)
Inputs for deciding new ambulance stations/hospitals
Easy communication of emergency accessibility to stakeholders
Conclusion: Why these outputs are valuable
When combined, Closest Facility and Service Area provide a complete emergency response planning toolkit:
Closest Facility supports dispatch decisions (who responds + which route).
Service Area supports policy and planning (who is covered + who is not).
These outputs help reduce response time, identify underserved regions, justify infrastructure upgrades, and improve emergency readiness using real road network constraints.