
.png)

INTRODUCTION
Flood risk Assessment is an assessment of an area to the exposure to risk of floods either from man-made or natural floods. The factors which increase the risk of floods are intensity of rainfall, slope and elevation of the area, type of soil present, density of population, drainage density, land use and land cover, distance from rivers, urbanization, increase in silt and many more. Here, we are considering major 6 factors for assessing the risk of floods in the union territory Delhi.
The risk of floods all around India is increasing because of various geographical and man- made factors. Some of the Geographical factors are elevation, rainfall, slope, land cover and so on. Some of the man-made factors are land use, built-up area, dam construction along the rivers and its tributaries, construction on the banks of the rivers, deforestation, sand mining, land- slides and so on. Intensity of Natural factors also gets affected by man-made activities. For example, Intensity and timing of rainfall are varying because of the increase in greenhouse effect which increases the temperature of the area. This variation in temperature affects the atmospheric pressure. The variation in the atmospheric pressure varies the direction of trade winds as well as monsoon winds which results in fluctuation of time of monsoon in India.
There are few factors like deforestation, urbanization and so on that can be reduced because of which the effect on natural activities can be restricted. The awareness among the people is necessary which can help in reducing disasters. Creating emergency shelters in flood-prone areas also helps in reducing the loss of life at the time of disaster.
Globally, the average rate of sea level rise has been approximately 3.3 millimeters per year over recent decades. As per the data released by Nature in 2021, 27.7% of the Indian population are exposed to the risk of flooding. Nearly 400 million people are at the risk of flooding. In the study area – Delhi, there are multiple rivers with high water levels like Yamuna and its tributaries which covers most part of Delhi. As per the Supreme Court Order of 2014, floodplains of Delhi are delineated at 300 meters on either side of the river Yamuna, 100 meters on either side of drains feeding Yamuna and 50 meters for tertiary drains and water bodies like lakes and ponds. This delineation increases the risk of flooding. The flood plains have reduced in width from an average 800 meters in 1986 to an average of 300 meters in 2016 because of construction and developments that came up on the flood plains and resultant loss of the eco- fragile ecosystem. The average number of annual rainy days have increased by 9 rainy days while the average precipitation per rainy day has increased by 2.5 per cent.
Summing up, it is evident that the annual precipitation and number of rainy days are increasing and the actual duration of precipitation has reduced leading to a sharp rise in rainfall intensity from 13.2 mm/hour in 1986 to 22.9 mm/hour in 2016, the latter leading to inundation of over 50 per cent of city in 2016 in three hours.
The above data shows the increase in the intensity of rainfall which increases the level of river flow. This fluctuation will increase the risk of flooding. So, the study of flood risk assessment is very much necessary to know the intensity of threat in a particular area of interest. This study helps us to understand the areas under the threat of flooding and the areas which can be the safe places during flooding. It also helps us to find out the shelter areas during flooding and helps to establish safe harbors for those who have lost their family and shelter in flooding.
Study area:
Delhi is in the northern part of India, and its geographical coordinates are approximately: Latitude: 28.4047° N to 28.8835° Longitude: 76.8389° E to 77.3476°E. One of the busiest states in India is Delhi, which has highly populated urban centers. River level rises because of the widespread use of concrete, asphalt, and other construction materials in structures, roads, and pavements. These materials avoid seepage of rain water and increase the runoff. As a result of urbanization, green spaces and vegetation are frequently eliminated. These elements are essential for controlling runoff because they absorb the rain water and that helps in reducing the runoff.
The increase in tourism and the construction in the urban areas of the Himalayan region is increasing the temperature resulting in an increase in melting of glaciers. The increase in settlements and increase in vehicular emissions creates a greenhouse effect which increases the melting of glaciers.
The increase in the silt level also increases the risk of flooding. The silt level is increasing because of landslides happening in the Himalayan regions. The increase in construction at the bank of the rivers also increases the silt level in the rivers.
So, controlling the factors affecting the rise in the river level reduces the risk of floods in the urban areas and spreading awareness among the people about the threats and the remedies of flooding reduces the loss of life.

MATERIALS AND METHODS
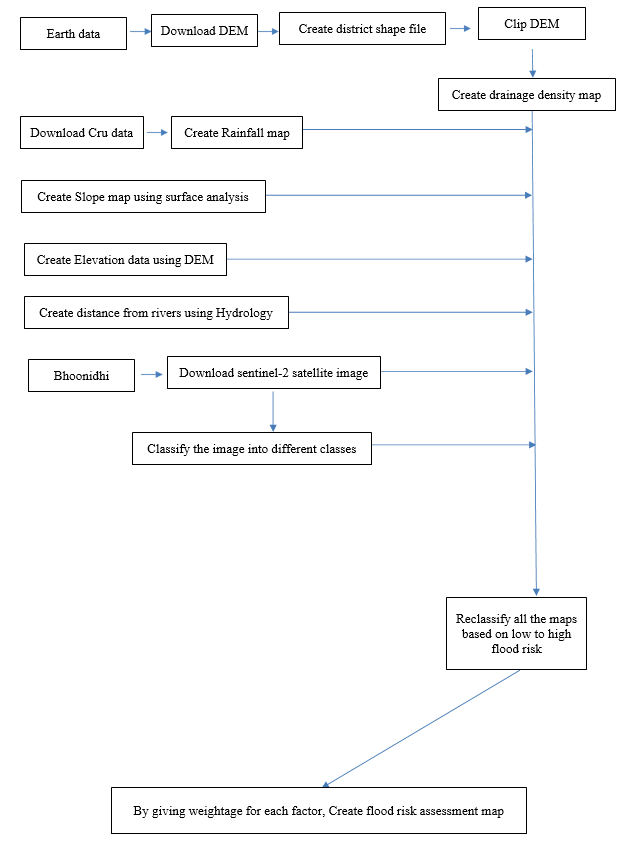
Data to be Downloaded:
1. Digital Elevation Model of Delhi – This is downloaded from Earth Data (https://search.earthdata.nasa.gov/search).
2. Indian Districts – available in Survey of India (https://onlinemaps.surveyofindia.gov.in/Product_Specification.aspx).
3. Cru data – Indian precipitation data (https://crudata.uea.ac.uk/cru/data/hrg/).
4. Sentinel-2 Satellite Image (https://bhoonidhi.nrsc.gov.in/bhoonidhi/index.html).
Factors Considered Affecting Risk Of Flooding
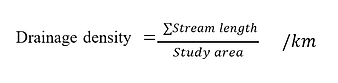
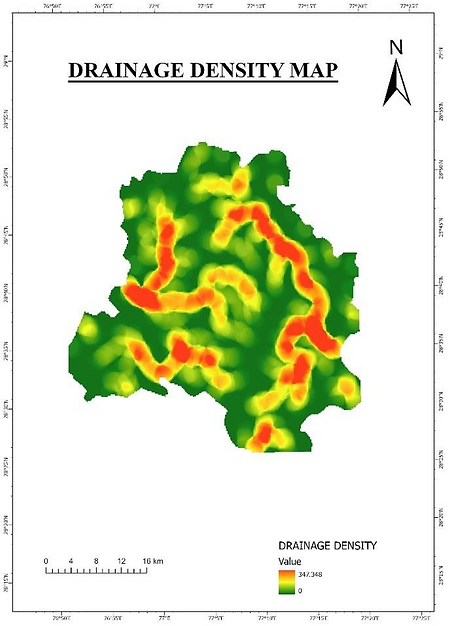
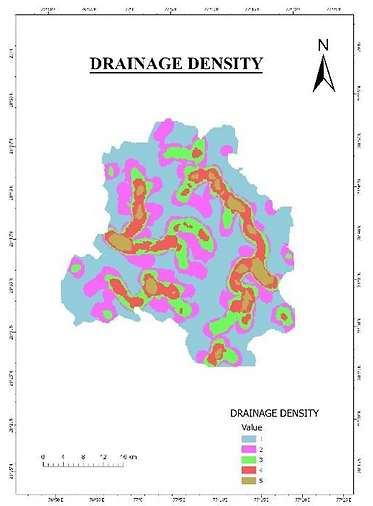
1. Drainage Density – It is the density of rivers in a particular area. It is directly proportional to the risk of floods.
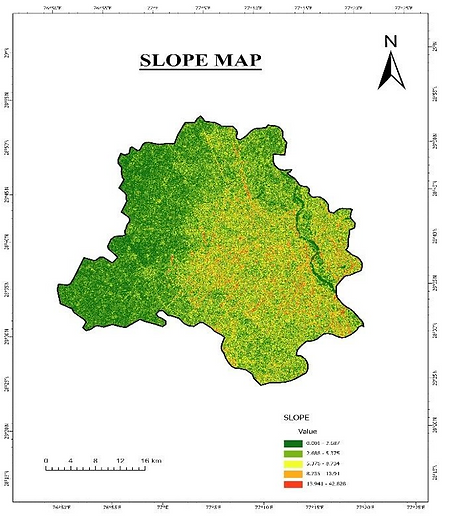
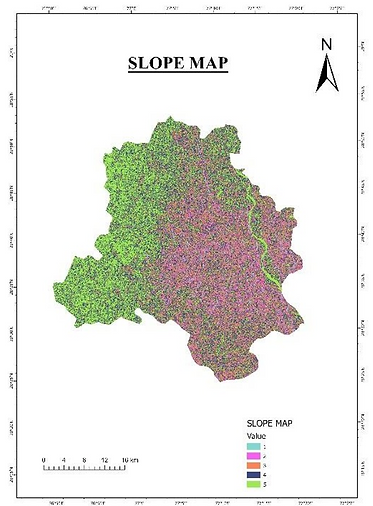
2. Slope – Slope is the degree of steepness of an area. It is inversely proportional to the risk of flooding because as the slope increases, the speed of runoff also increases because of which stagnation reduces.
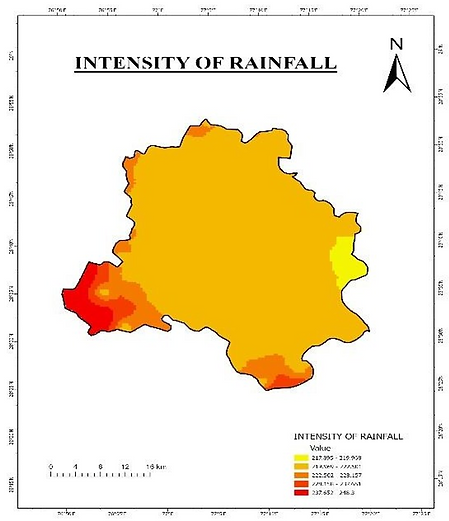
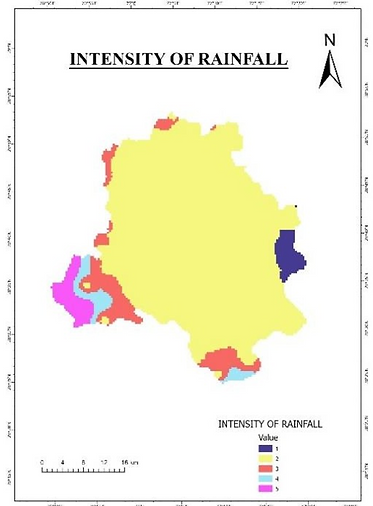
3. Rainfall – It is the major factor which increases the risk of flooding. It is directly proportional to the risk of flooding.
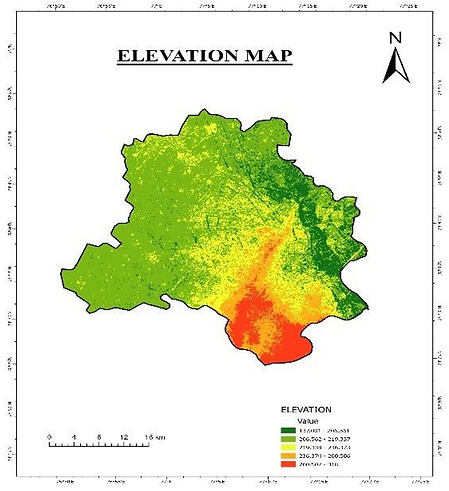
4. Elevation – Elevation is the height of an area from the sea level. It is inversely proportional to the risk of flooding.
5. Land Use and Land Cover – It is coverage of land by vegetation and usage of land for human activities.
6. Distance from rivers – The distance from rivers is calculated using the Euclidean distance. Distance is inversely proportional to the risk of floods.
Drainage Density MAP
1. Download the digital elevation model from the earth data mentioned above of the area of interest. Since there was unavailability of DEM file of the area of interest. Download two adjacent DEM files and Mosaic both the DEM files using Geo-processing.
2. Using the shape file of the area of interest – Delhi, clip the mosaic file to the boundary of Delhi.
3. To create Drainage Density, Streams must be created using geo-processing tools.
4. Initially, Fill is used which sinks in the surface raster and removes small imperfections in the data. This is available in hydrology as a geo-processing tool.
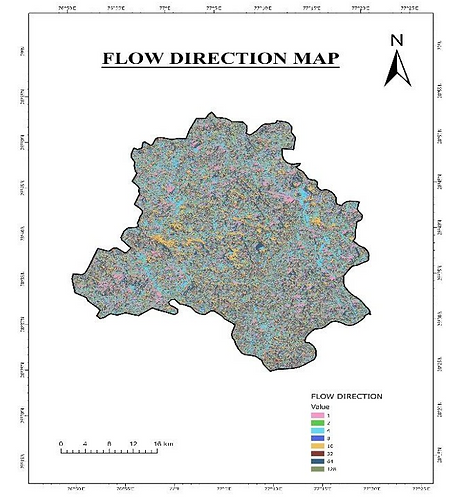
5. Later, Flow Direction is used to check the flow of rain water on the surface.
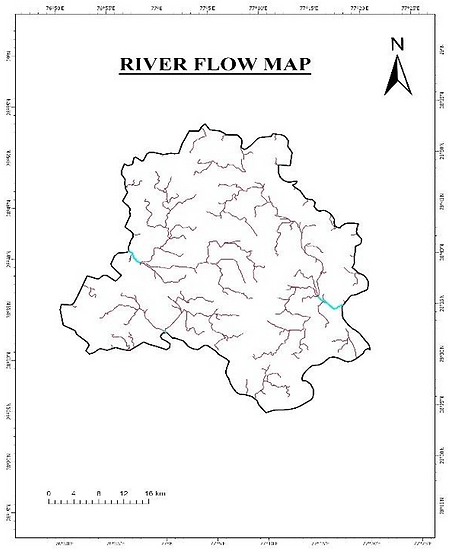
6. Using flow direction, we can get the stream order of the flowing water which is a raster data.
7. When we convert stream order from raster to vector data, the stream becomes completely visible.
8. Open the attribute table of streams and add ‘stream length’ field. Calculate the geometry of the streams in the fields itself.
9. Now, open the attribute table of the study area and add an ‘area’ field and calculate the area of the study area.
10. Add a field ‘Stream density’ in the attribute table. Using the total length of the stream and the area of the study area, we can find out the Drainage/stream density by using the formula in the raster calculator

Slope MAP
-
Slope map is created using Slope (Spatial analyst tools) in Geo-processing. DEM is used as an input raster.
Intensity of Rainfall MAP
1. Precipitation data is downloaded using Cru data.
2. Using Make netCDF to raster layer (multi-dimensional tools) in Geo-processing, export the pre- layer by giving the local projected coordinate system of the study area and clip it to the study area.
3. Select the bands of the required months and create composite bands (Data management tools) using those bands.
4. There are two methods to convert raster value to points.
• Raster to points: This converts raster to points and the values of raster are also assigned to those points.
• Create random points: This creates random points on the raster but the raster values are not assigned to these points. We must use ‘extract values from raster to points’ (Spatial analyst tools)
5. Using these points, Interpolation is done using IDW (Inverse Distance Weighting).
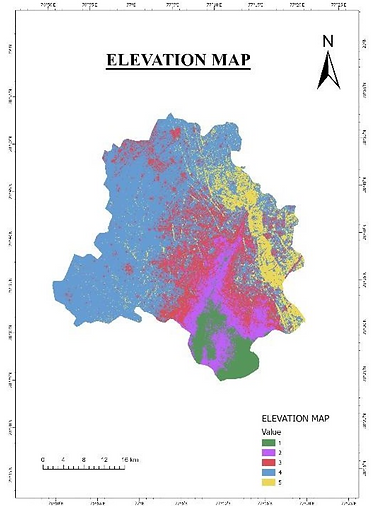
Elevation MAP
1. The value of raster in DEM itself is the elevation of that area. So, we can use the DEM file to create the elevation map.
2. Using Symbology of the DEM file, we can represent the variation in elevation.
Land Use And Land Cover (Image Classification)
-
Download all the required bands of the sentinel-2 from the Bhoonidhi website.
-
Create composite bands using the required combination of bands.
-
Add the study area and remove the color of the study area. Increase the boundary thickness of the study area.
-
Change the combination of bands using symbology.
-
Go to classification tools in Imagery and create a new schema.
-
Draw a minimum of 25 samples for each training sample and collapse all to one sample name. Add all training samples and save the schema.
-
Go to Classification wizard (Imagery) and with the classification method supervised and classifier as maximum likelihood, run the tool.
-
Later, clip the classified image to the study area and export.
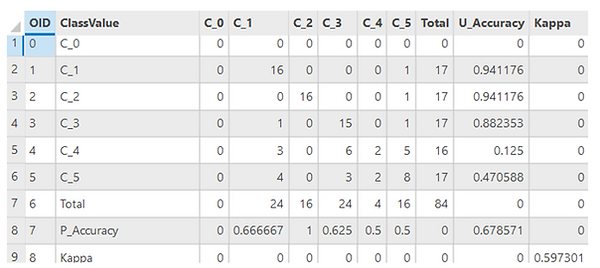
Evaluating Accuracy
-
Add a Classified image to the map. Using Geo-processing, go to segmentation and classification and create accuracy assessment points.
-
Convert those points to KML files using conversion tools and save it.
-
Open the KML file saved from google earth. Set the date of google earth to that of the downloaded satellite date.
-
Check all the points in the google earth and add those correct sample values to the attribute table under the field ‘ground truth’.
-
Using a compute confusion matrix (spatial analyst tools), calculate the accuracy.
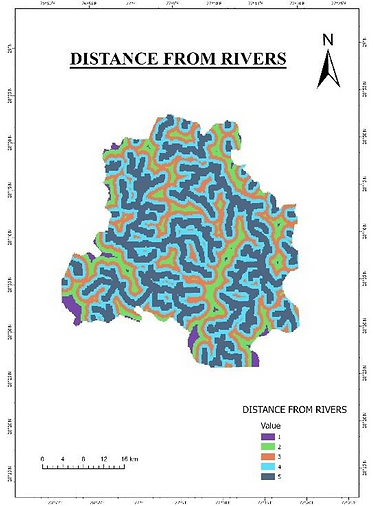
Distance From Rivers Map
-
Distance from rivers is helpful in understanding the intensity of risk of floods from the rivers.
-
The distance is calculated using Euclidean distance from the streams that have been created before for drainage density map.
-
Clip the distance from rivers map to the study area.

These are the few major factors which affect the risk of floods in the study area. The above maps are classified based on their own characteristics. These maps must be reclassified based on the hierarchy of risks from floods which can be used to create the risk of floods with a classification from high risk to low risk according to the weightage of these factors based on different scientific research.
RECLASSIFICATION OF MAPS
-
Reclassification of maps is done in a range from very low risk to very high risk with a value of 1 to 5.
-
Reclassify (Spatial Analyst tools) in geo-processing is used to reclassify maps.

RECLASSIFIED MAPS (change the maps)

These are the reclassified maps based on the hierarchy of risk of floods from very low risk to very high risk.
Weighted SUM
-
Weighted sum is a method used to combine multiple inputs into integrated output based on weightage given to each input.
-
Weighted sum (Spatial Analyst tools) in Geo-processing is used to give weightage for each input to get the desired output.

These weightages are given based on different scientific researches which are mentioned in the References.
RESULT AND CONCLUSION

The final flood risk map after giving the weightage for each factor.
-
All the factors mentioned above with their weightage are given in weighted sum to get the desired output.
-
In this output, Rainfall has been given a weightage of 45%. So, most of the high-risk locations are in the south-west part of Delhi.
-
Area around the river has a moderate rainfall but it is a low-lying area according to the elevation map. It is also a high-risk area according to all other maps. So, the area is at moderately risk of floods.
-
Central to southern part of Delhi is elevated. So, the area is at low-risk of floods.
-
Some parts of Northern Delhi have moderate rainfall with moderate slope. It also is a moderately elevated area compared to other areas. Therefore, the risk of floods in these areas are moderate.
-
So, overall analysis shows that Delhi is at low to moderate risk of floods but some parts like south-west is at high-risk because of high intensity of rainfall.
Reference:
-
R Merz, B., Kreibich, H., Schwarze, R., & Thieken, A. (2010). Review article" Assessment of economic flood damage". Natural Hazards and Earth System Sciences, 10(8), 1697-1724.
-
Bates, B., Kundzewicz, Z., & Wu, S. (2008). Climate change and water. Intergovernmental Panel on Climate Change Secretariat.
-
Neal, J., Keef, C., Bates, P., Beven, K., & Leedal, D. (2013). Probabilistic flood risk mapping including spatial dependence. Hydrological Processes, 27(9), 1349-1363.
-
Smith, M. D. (2011). The ecological role of climate extremes: current understanding and future prospects. Journal of Ecology, 99(3), 651-655.
-
Buytaert, W., Célleri, R., De Bièvre, B., Cisneros, F., Wyseure, G., Deckers, J., & Hofstede, R. (2006). Human impact on the hydrology of the Andean páramos. Earth-Science Reviews, 79(1-2), 53-72.
-
Kreibich, H., Van Loon, A. F., Schröter, K., Ward, P. J., Mazzoleni, M., Sairam, N., ... & Di Baldassarre, G. (2022). The challenge of unprecedented floods and droughts in risk management. Nature, 608(7921), 80-86.
-
Hirabayashi, Y., Mahendran, R., Koirala, S., Konoshima, L., Yamazaki, D., Watanabe, S., ... & Kanae, S. (2013). Global flood risk under climate change. Nature climate change, 3(9), 816-821.