.png)
Mapbox Studio: Transforming the World of Interactive Mapping
- SAHANA A

- Dec 16, 2024
- 3 min read
Introduction
Maps are no longer static images; they are dynamic tools that help us understand and navigate the world. Mapbox, a leading geospatial platform, has revolutionized how we build and interact with maps. Its advanced tools and APIs enable developers and designers to create maps that are not only visually stunning but also highly functional and interactive.
From basic visualizations to complex geospatial analysis, Mapbox offers everything needed to develop location-based applications. Whether you are designing a navigation system, a data visualization dashboard, or an augmented reality experience, Mapbox provides the flexibility and scalability to bring your ideas to life.
Exploring Mapbox Studio: A Visual Design Tool
Mapbox Studio is the heart of the Mapbox ecosystem, allowing users to design and manage custom maps visually. It’s particularly useful for creating branded maps or adding geospatial data without needing advanced coding skills.
Steps to style a map in mapbox studio
1. Dataset or Tileset
Datasets:
These are raw data collections that you can edit directly in Mapbox Studio. Datasets are ideal for projects requiring frequent updates or dynamic styling.
Steps to Add a Dataset:
Navigate to the "Datasets" section in Mapbox Studio.
Click "New Dataset" or upload an existing file in formats shown.
Use the visual editor to add, remove, or modify features.


Tilesets:
Tilesets are pre-processed, optimized geospatial data, perfect for rendering large datasets on maps. Once uploaded, tilesets are ready for use in maps without additional processing.
Steps to Upload a Tileset:
Go to the "Tilesets" section in Mapbox Studio.
Click "New Tileset" and upload files.
Publish the tileset to use it in your maps.


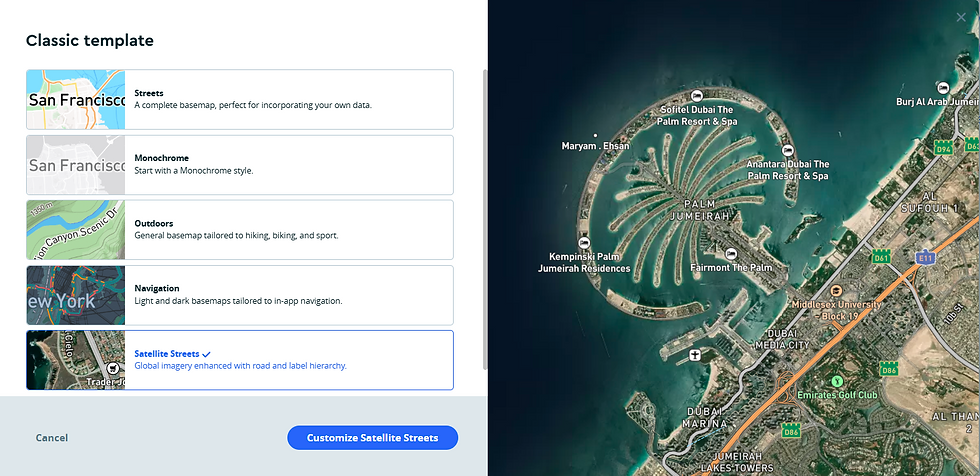
2. Basemaps and Styles
Basemaps provide the foundational layer of your map. Mapbox offers several pre-designed basemaps.
3. Go to the Layers Tab
Navigate to the Layers tab within Mapbox Studio. This is where you manage and customize the layers of data displayed on your map.
4. Add a Layer
Click Add Layer to introduce a new data layer to the map.
Select Custom Layer if you want to add your own tileset or data source.
Source: Choose the source of your data (e.g., your uploaded tileset).
Select Your Tileset: Pick the tileset you want to work with for this layer.
5. Choose Layer Type and Set Zoom Range
Layer Type: Select the type of layer you want to use:
Fill: For area data (polygons).
Line: For linear data (e.g., roads, boundaries).
Heatmap: For visualizing data density.
Zoom Range Limit: Set the zoom range at which this layer should be visible. For example, you can make certain layers visible only at certain zoom levels.
6. Go to the Style Section
After adding your layer, go to the Style section. This is where you adjust the appearance of the layer and the map.
Customize the following:
Colors: Change the color scheme for your data layer, roads, land, water, etc.
Width: Adjust the line width for roads or boundaries.
Opacity: Modify the opacity of the layer to control its transparency.
Text & Labels: Customize labels, fonts, and their placement on the map.
7. Publish the Map
Once you're satisfied with the styling, click Publish to save your changes. This will make your map style available for use.
Preview and test your changes before publishing.

Adding Maps to the Website
Steps to Embed a Map:

Example Code:

For non-interactive maps, the Static Images API generates a map image that can be embedded on a webpage.

For interactive maps, Mapbox GL JS offers unparalleled customization and interactivity. You can control every aspect of the map, from its layers to user interactions.
Advantages of Mapbox GL JS:
Real-time updates and styling.
Support for 3D maps and dynamic data layers.
Event handling for custom interactivity.
Mapbox GL JS: Adding Maps Dynamically
Mapbox GL JS is a JavaScript library that enables developers to render interactive maps directly in web browsers. It uses WebGL to render maps efficiently, even with large datasets.
1.Include the Library: Add the Mapbox GL JS library and CSS to your project.

2.Set Up the HTML Container: Create a container element for your map.

3. Initialize the Map: Use JavaScript to render the map in the container.

Adding Interactivity
Mapbox GL JS supports advanced interactivity. For instance, you can add popups or handle map events.
Adding a Popup:


Clustering
Cluster points dynamically based on zoom level.


3D Visualization with terrain
Add depth to your map with building extrusions.


Conclusion
Mapbox is a game-changer in the mapping world, offering tools for developers and designers to create highly customized, interactive maps. From simple embed links to advanced integrations with Mapbox GL JS, the platform caters to a wide range of needs. By leveraging Mapbox Studio for visual design and Mapbox GL JS for dynamic programming, you can build maps that are both functional and visually stunning. Start your mapping journey with Mapbox and explore endless possibilities.


Comments